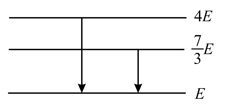
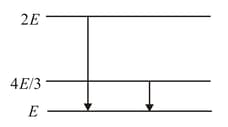
The following diagram indicates the energy levels of a certain atom when the system moves from level to , a photon of wavelength is emitted. The wavelength of photon produced during its transition from level to is
Important Questions on Atomic Physics
The energy levels of the hydrogen spectrum is shown in the figure. There are some transitions ,, , and . Transition , and respectively represent
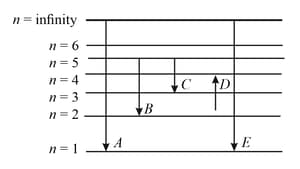
In the given figure and respectively represent
 ,
,
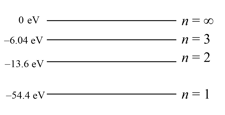
The energy level diagram for a hydrogen-like atom is shown in the figure. The radius of its first Bohr orbit is
The following diagram indicates the energy levels of a certain atom when the system moves from level to . A photon of wavelength is emitted. The wavelength of photon produced during its transition from level to is . The ratio will be