
The following table gives the distribution of intelligence quotient (IQ) of pupils of class VIII in a school.
IQ
Number of pupils
Draw a histogram for the above data.
Important Questions on Data Handling
The given histogram depicts the marks obtained by students of a class:

What is the class size?
The given histogram depicts the marks obtained by students of a class:

How many students obtained less than marks?
The given histogram depicts the marks obtained by students of a class:

How many students obtained or more marks but less than marks?
The given histogram depicts the marks obtained by students of a class:

What is the interval of highest marks and how many students are there in this interval?
The given histogram depicts the marks obtained by students of a class:
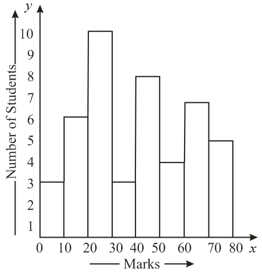
If the passing marks are what is the number failures?
The number of hours spent by a school boy in different activities in a working day is given below:
| Activity | Sleeping | School | Homework | Playing | Others | Total |
|---|---|---|---|---|---|---|
| Number of hours |
Present the information in the form of a pie chart.
Draw a pie diagram to represent the following data on the proposed outlay during the fourth Five-year plan.
| Items | Agriculture | Industries and minerals | Irrigation and power | Communication | Miscellaneous |
|---|---|---|---|---|---|
| (in crore) |
Draw a pie chart for the following data of expenditure pattern in a family.
| Items | Food | Clothing | Rent | Education | Miscellaneous |
|---|---|---|---|---|---|
| Expenditure |


