
The histogram shows the relative frequency of items sold at different prices at a community fundraising event. There were items in total.
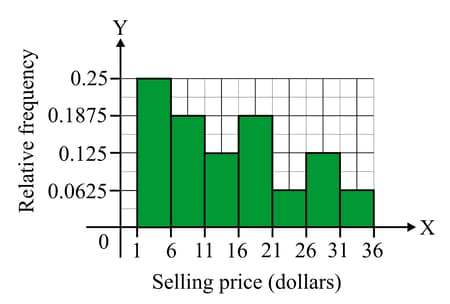
Calculate how many items sold for less than dollars.
Important Questions on City Skylines (Histograms)
The lengths, in centimeters, of some horned vipers are recorded in the table.
| Length | Frequency | Class width | Frequency density |
Copy and complete the table.
The lengths, in centimeters, of some horned vipers are recorded in the table.
| Length | Frequency | Class width | Frequency density |
Construct a frequency density histogram for this data.
The ages of people visiting the Eiffel Tower are recorded in the table.
| Age, (years) | Frequency |
Construct a frequency density histogram for this data.
The ages of people visiting the Eiffel Tower are recorded in the table.
| Age, (years) | Frequency |
Construct a frequency density histogram for this data. From the graph, Voleta estimates that there were ten visitors between and years old, and ten visitors between and years old. Explain the assumption Voleta has made.
The ages of people visiting the Eiffel Tower are recorded in the table.
| Age, (years) | Frequency |
Construct a frequency density histogram for this data. From the graph, Voleta estimates that there were ten visitors between and years old, and ten visitors between and years old.
State whether you think this is a reasonable assumption. Justify your answer.
The ages of people visiting the Eiffel Tower are recorded in the table.
| Age, (years) | Frequency |
State the modal class for this data.
The doctors at a medical center see patients in total during morning surgery. The table gives information about the lengths of these appointments in minutes.
| Length, (min) | Frequency |
Construct a frequency density histogram for the information.
The doctors at a medical center see patients in total during morning surgery. The table gives information about the lengths of these appointments in minutes.
| Length, (min) | Frequency |
Calculate an estimate for the number of patients who saw their doctor for between and minutes.
Number of patients should be a integer without any decimal places, so round it off to zero decimal places.


