
The pie chart shows the favourite subjects of students.
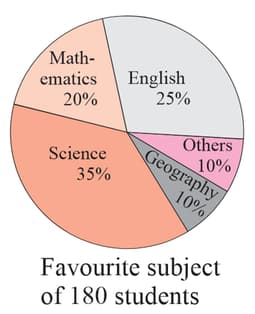
Find the number of students whose favourite subject is 'English'.
Important Questions on Data Handling and Graphs
A shop sells three grades of coffee, which are Platinum, Gold and Silver. The pie chart represents the weight (in ) of each grade of coffee sold on a particular day. The total weight of coffee sold was .
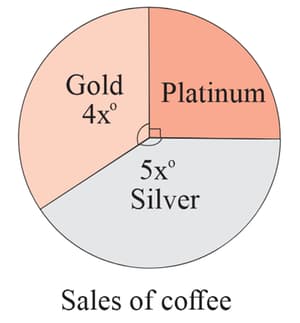
Find the value of .
The pie chart shows the proportions of students by age in a class. There are students who are years old.
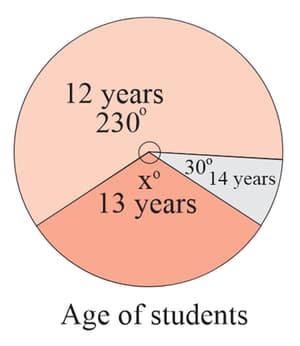
Find the value of ,
The pie chart shows the proportions of students by age in a class. There are students who are years old.

Find the total number of students in the class,
The pie chart shows the proportions of students by age in a class. There are students who are years old.

Find the number of students who are years old.
Look at the diagram given below.
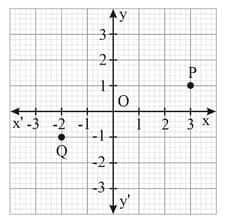
State the coordinates of the points and .
Look at the diagram given below.
State the quadrants in which and lie.
Using a scale of to unit on both axes, plot the points and on a sheet of graph paper.


