Auto Generation Of Tests
Academic Success is an established term in the domain of education and assessment that has gone from common measures like grades in a series of exams to include many student outcomes over the years. There has been a rapid expansion of studies to identify measures that show academic success is not just the marks obtained in an exam but also the learning and holistic development of a student, including improvement in a student’s attitude towards any exam or academic problems, educational or otherwise. At Embibe, we have already developed various parameters to measure a student’s performance in tests like Embibe Score Quotient. We have been using various standardized models like Concept Mastery that rely heavily on Bayesian Knowledge Tracing Algorithm.
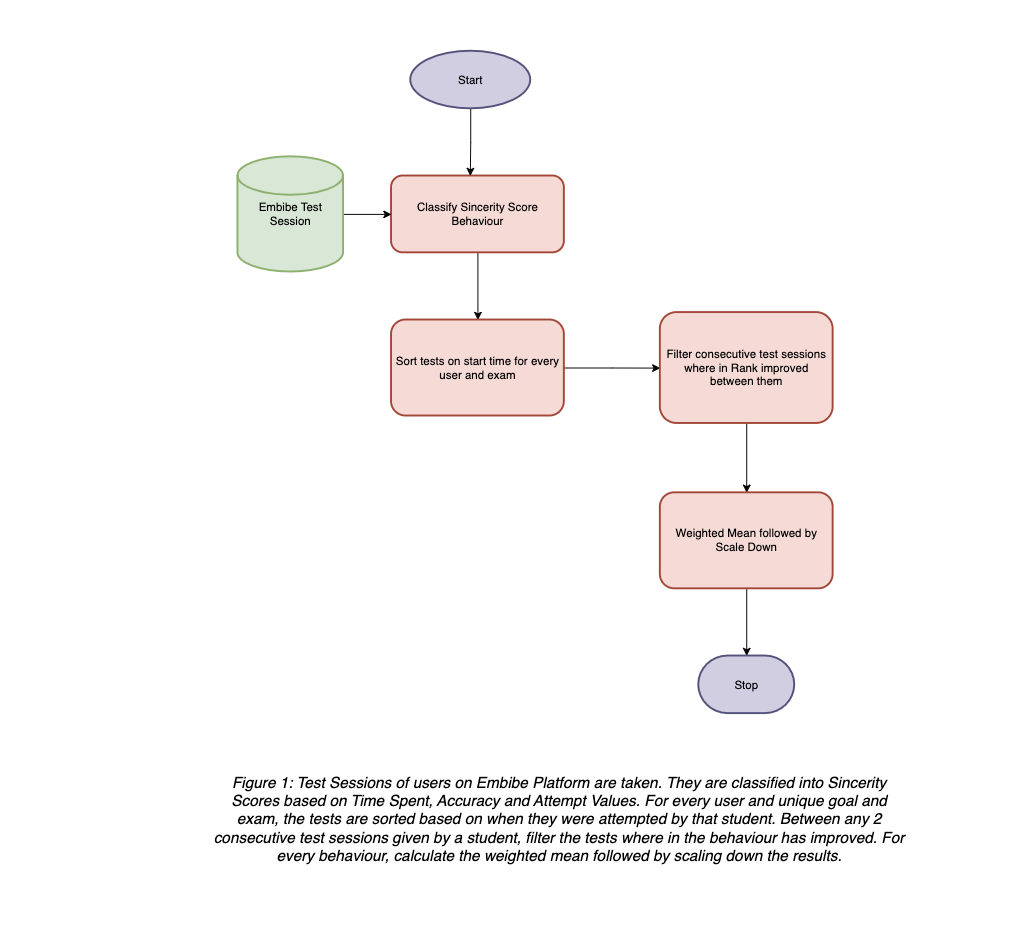
Recently, we developed a new metric- Sincerity Score that measures a student across 3 parameters and allocates a behavior or a combination of behaviors.
Each parameter is classified into different partitions that culminate in 10 unique behaviors – 4 positive, 5 negative, and 1 neutral behavior. A rank is allocated to each of the behaviors, from best behavior to the worst possible behavior. Over 2.5 million valid test sessions are analyzed to develop an algorithm to identify test-on-test score improvement of every behavior compared to less positively ranked behavior. The results verify and quantify in a data-driven manner a fact long thought to be true that a student’s attitude helps determine their progress and can help even a below-average student achieve great results. Based on the thresholds and classification of students’ test session behavior, we can quantify how fast a behavior improves on average compared to less positive behavior and nudge students towards the appropriate behavior, and intimate students about the progress rate they can achieve with the improved behavior, thus improving learning outcomes.
Table 1: Different Sincerity Score behaviors with their metadata
| Sincerity Score | Meaning | Rank/weight (1->best, 10->worst) |
Attribute |
|---|---|---|---|
| In Control | The child is putting in the needed effort and succeeding often | 1 | Positive |
| Marathoner | The stamina of the average session duration is high | 2 | Positive |
| Trying Hard | The child is putting much effort and still not unable to succeed often | 3 | Positive |
| Getting There | The stamina of the average session duration is average | 4 | Positive |
| Slow | The child can succeed with much effort | 5 | Neutral |
| Train Harder | The child is not putting enough effort to succeed very often | 6 | Negative |
| Overconfident | The child is dominantly overconfident and applying themself without putting enough effort | 7 | Negative |
| Low Confidence | The child is not confident enough to apply themself | 8 | Negative |
| Jumping Around | The stamina of the average session duration very low | 9 | Negative |
| Careless ( Lack of interest, lack of focus, lack of concentration ) |
The child is dominantly underapplying themself to the material at hand and losing marks as a result. | 10 | Negative |
N: Total number of valid test sessions with positive score improvement
p: Number of Sincerity Score behaviors.
Outputs:
For every Sincerity Score behavior (Ranks 1-9), on average, how much faster the test-on-test improvement is observed to all less positive Sincerity Score behavior.
Glossary:
Procedure:
| Behavior | Average Improvement Ratio | SSS String |
|---|---|---|
| In Control | 6.59 | In Control typically improve s 6.6x faster than students exhibiting lower behaviors. |
| Marathoner | 7.14 | Marathoner typically improves 7.1x faster than students exhibiting lower behaviors. |
| Trying Hard | 8.49 | Trying Hard typically improves 8.5x faster than students exhibiting lower behaviors. |
| Getting There | 6.19 | Getting There typically improves s 6.2x faster than students exhibiting lower behaviors. |
| Slow | 4.28 | Slow typically improves 4.3x faster than students exhibiting lower behaviors. |
| Train Harder | 3.85 | Train Harder typically improves 3.8x faster than students exhibiting lower behaviors. |
| Overconfident | 5.51 | Overconfident typically improves 5.5x faster than students exhibiting lower behaviors. |
| Low Confidence | 1.05 | Low Confidence typically improves 1.0x faster than students exhibiting lower behaviors. |
| Jumping Around | 0.69 | Jumping Around typically improves 0.7x faster than students exhibiting lower behaviors. |
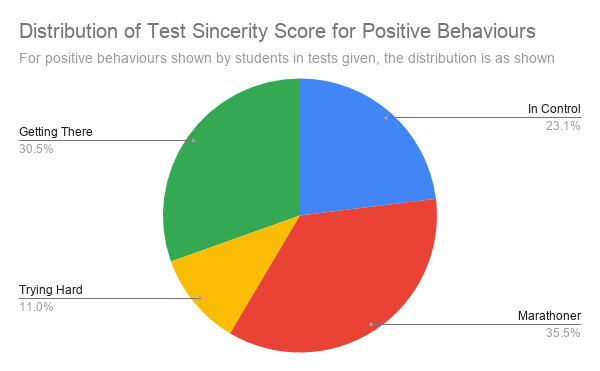
Amongst the 4 positive behaviors, it is observed that most students’ test sessions tend to show Marathoner ( 35.4% ) and Getting There ( 30% ) behavior. Amongst the negative behaviors, students tend towards Jumping Around ( 33% ) and Train Harder ( 50% ).