Auto Generation Of Tests
Tests are the most preferred assessment technique used by learners to measure performance against the targeted learning outcomes. So tests must be fair and effective to identify students’ learning gaps and boost students’ learning. The ability of a test to meet these goals is an aggregation of how relevant each question of the test is. Thus, the reliability of a test can be increased by item analysis, where students’ responses for each question (item) are utilized to evaluate test performance. One of the important methods in Item Analysis is Item discrimination which refers to the power of a question in differentiating between different learners. Question Discrimination Factor (QDF) is an index that measures how well a question can differentiate between different user cohorts. It depicts how top scorers are more likely to get a question correct than low scorers.
To compute the QDF of questions, Embibe has used traditional statistical (Item Point Biserial Correlation) and deep learning-based methods. Item Point Biserial Correlation is basically Pearson-product moment correlation between question score and total score for a student. So higher the difference between total scores of students who got the question correct and those who got the question incorrect higher will be the QDF value. We also implemented the 2PL model from classical Item Response Theory using Deep Neural Network architecture. Given the students’ attempts data, we derive the question’s difficulty level and discrimination factor from weights of trained DNN. Here is an example of how the value of QDF varies with question attempt interactions of learners.
| QDF = 0.11 | QDF = 0.80 |
|---|---|
| Question 1:Alcohols of low molecular weight are a. Soluble in all solvents (Correct Option) b. Soluble in water c. Insoluble in all solvents d. Soluble in water on heating |
Question 2:Aspirin is also known as a. Acetyl salicylic acid (Correct Option) b. Methyl salicylic acid c. Acetyl salicylate d. Methyl salicylate |
|

|
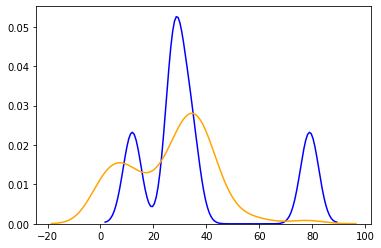
| Table 1: Comparison between the distribution of total marks for correct and incorrect questions with low QDF and high QDF values. | |
Here: the x-axis represents the total marks scored, and the y-axis represents the normalized number of students. The yellow line denotes the distribution of total marks of students who got the question incorrect. The blue line denotes the distribution of total marks of students who got the question correct. In Question-1, there is a high overlap between the total marks of students who got the question correct, while in Question-2, the overlap is very less and hence the value of QDF is higher for Question-2 than Question-1. The final QDF value is the fine-tuned result of the above method and test parameters.
Embibe conducted a validation experiment to compare the performance of students in two different tests :
For the experiment, a total of 312 students were selected to take a test containing 75 questions. Two statistical metrics compared the performances of the test:
| Policy | RMSE | Rank corr p |
|---|---|---|
| Baseline Policy | 0.844 | 0.59 |
| Discrimination Only Policy | 0.549 | 0.83 |
| Table 2: Comparison of RMSE (inferred ability and ability from ground truth) and rank correlation ρ in tests generated by different policies Policies RMSE Rank corr ρ | ||
Also, we found that the Discrimination Only Policy test gives a 24.8% better spread of scores (score at 95th percentile of students – score at 5th percentile) than the Baseline Policy test.
Hence, the use of high QDF questions in tests improves the quality of the test in terms of its power to differentiate among students under the same targeted learning goals. Also, these are leveraged to improve content quality where we identify questions with negative QDF and improve their relevance and clarity.