


Ellipse: Do you know the orbit of planets, moon, comets, and other heavenly bodies are elliptical? Mathematics defines an ellipse as a plane curve surrounding...
Last Modified 14-04-2025

Harvest Smarter Results!
Celebrate Baisakhi with smarter learning and steady progress.
Unlock discounts on all plans and grow your way to success!

Ellipse: Definition, Properties, Applications, Equation, Formulas
April 14, 2025
Altitude of a Triangle: Definition & Applications
April 14, 2025
Manufacturing of Sulphuric Acid by Contact Process
April 13, 2025
Refining or Purification of Impure Metals
April 13, 2025
Pollination and Outbreeding Devices: Definition, Types, Pollen Pistil Interaction
April 13, 2025
Acid Rain: Causes, Effects
April 10, 2025
Congruence of Triangles: Definition, Properties, Rules for Congruence
April 8, 2025
Complementary and Supplementary Angles: Definition, Examples
April 8, 2025
Nitro Compounds: Types, Synthesis, Properties and Uses
April 8, 2025
Bond Linking Monomers in Polymers: Biomolecules, Diagrams
April 8, 2025
Introduction to data handling: It is said that data is the new oil in this modern age. Rightly so, we are working with data in one way or another. Students’ attendance, crop yield for a few years, runs scored in a cricket match are all data. We use this data to get valuable insights that can help us reach meaningful conclusions about the data. However, our data is not always in an easy-to-use form.
To make things more straightforward, we must process raw data. We can convert most of these data sets into numbers. The process of collecting data, recording it, and presenting it in a way that helps in making decisions is called data handling.

The following are the main steps involved in data handling:
1. Data Recording
2. Data Organisation
3. Data Presentation
4. Data Analysis
Consider an example of a class preparing its sports team. The class monitor, Nitin, asked his classmates to choose which game they would be participating in from the following – kabaddi, kho-kho, carom, or chess. All the students mark their choices on a sheet, and Nitin gets a sheet that looks as shown below.
| Student Roll Number | Game | Student Roll Number | Game | Student Roll Number | Game |
| \(1\) | Kabaddi | \(11\) | Chess | \(21\) | Kho-kho |
| \(2\) | Carrom | \(12\) | Kho-kho | \(22\) | Carrom |
| \(3\) | Kho-kho | \(13\) | Carrom | \(23\) | Kabaddi |
| \(4\) | Kho-kho | \(14\) | Chess | \(24\) | Kho-kho |
| \(5\) | Kabaddi | \(15\) | Kabaddi | \(25\) | Chess |
| \(6\) | Chess | \(16\) | Kho-kho | \(26\) | Kabaddi |
| \(7\) | Kho-kho | \(17\) | Kabaddi | \(27\) | Kho-kho |
| \(8\) | Carrom | \(18\) | Carrom | \(28\) | Carrom |
| \(9\) | Chess | \(19\) | Chess | \(29\) | Chess |
| \(10\) | Kabaddi | \(20\) | Carrom | \(30\) | Kabaddi |
Nitin uses this sheet for coordinating with different teams regarding their requirements, schedules, and registrations. However, when the number of students increases, it becomes increasingly difficult to count the number of students per team and thus make the proper arrangements.
Looking at Nitin’s arrangement of his class teams on the school sports day, the principal asks him to coordinate the entire school’s team for the annual inter-school competition next month. Nitin is a little overwhelmed by this responsibility as he has to manage more than \(100\) students.
“No worries! There’s an easy way out.”, says Diya.
Counting the number of students from the list shown above is time-consuming. Instead, they can mark the number of students across each game as shown below.
| Game | Student Roll Number | Student Count |
| Kabaddi | \(1,5,10,15,17,23,26,30\) | \(8\) |
| Kho-kho | \(3,4,7,12,16,21,24,27\) | \(8\) |
| Carrom | \(2,8,13,18,20,22,28\) | \(7\) |
| Chess | \(6,9,11,14,19,25,29\) | \(7\) |
Now this list is more straightforward, right? While recording the data for \(100\) students, we can write the roll numbers of the students against the game they are interested in, and we can readily have the count, which can help Nitin in his coordination. What Diya did is called the organisation of data.
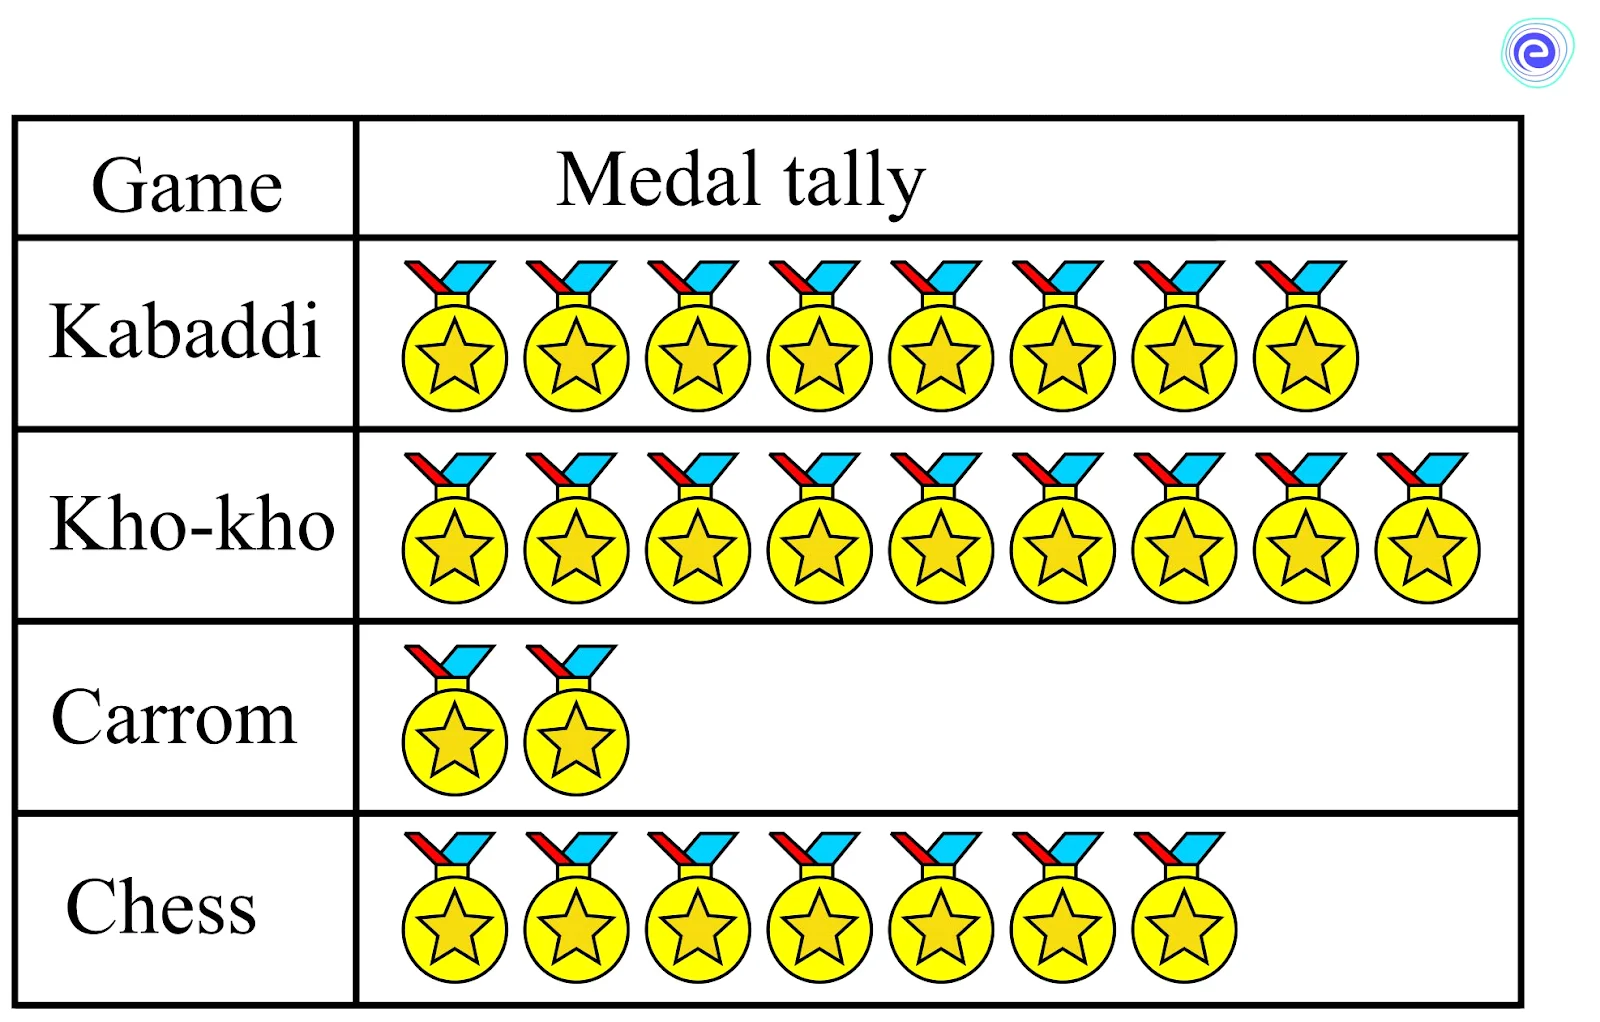
We can present a data set graphically to explain itself to the viewers. Consider this example. Nitin’s sports teacher had the following datasheet for the inter-school competitions in the last ten years.
| Game | Medal tally |
| Kabaddi | \(8\) |
| Kho-kho | \(9\) |
| Carrom | \(2\) |
| Chess | \(7\) |
The school is not performing well in carrom. The sports teacher showed the following graph to the principal, and it became clear that there was a need for more carom training for the students.
The school is not performing well in carrom. The sports teacher showed the following graph to the principal, and it became clear that there was a need for more carom training for the students.
Other methods to graphically represent data are listed below.
| Type of Graph | Medal Tally Representation |
| Bar Graph | 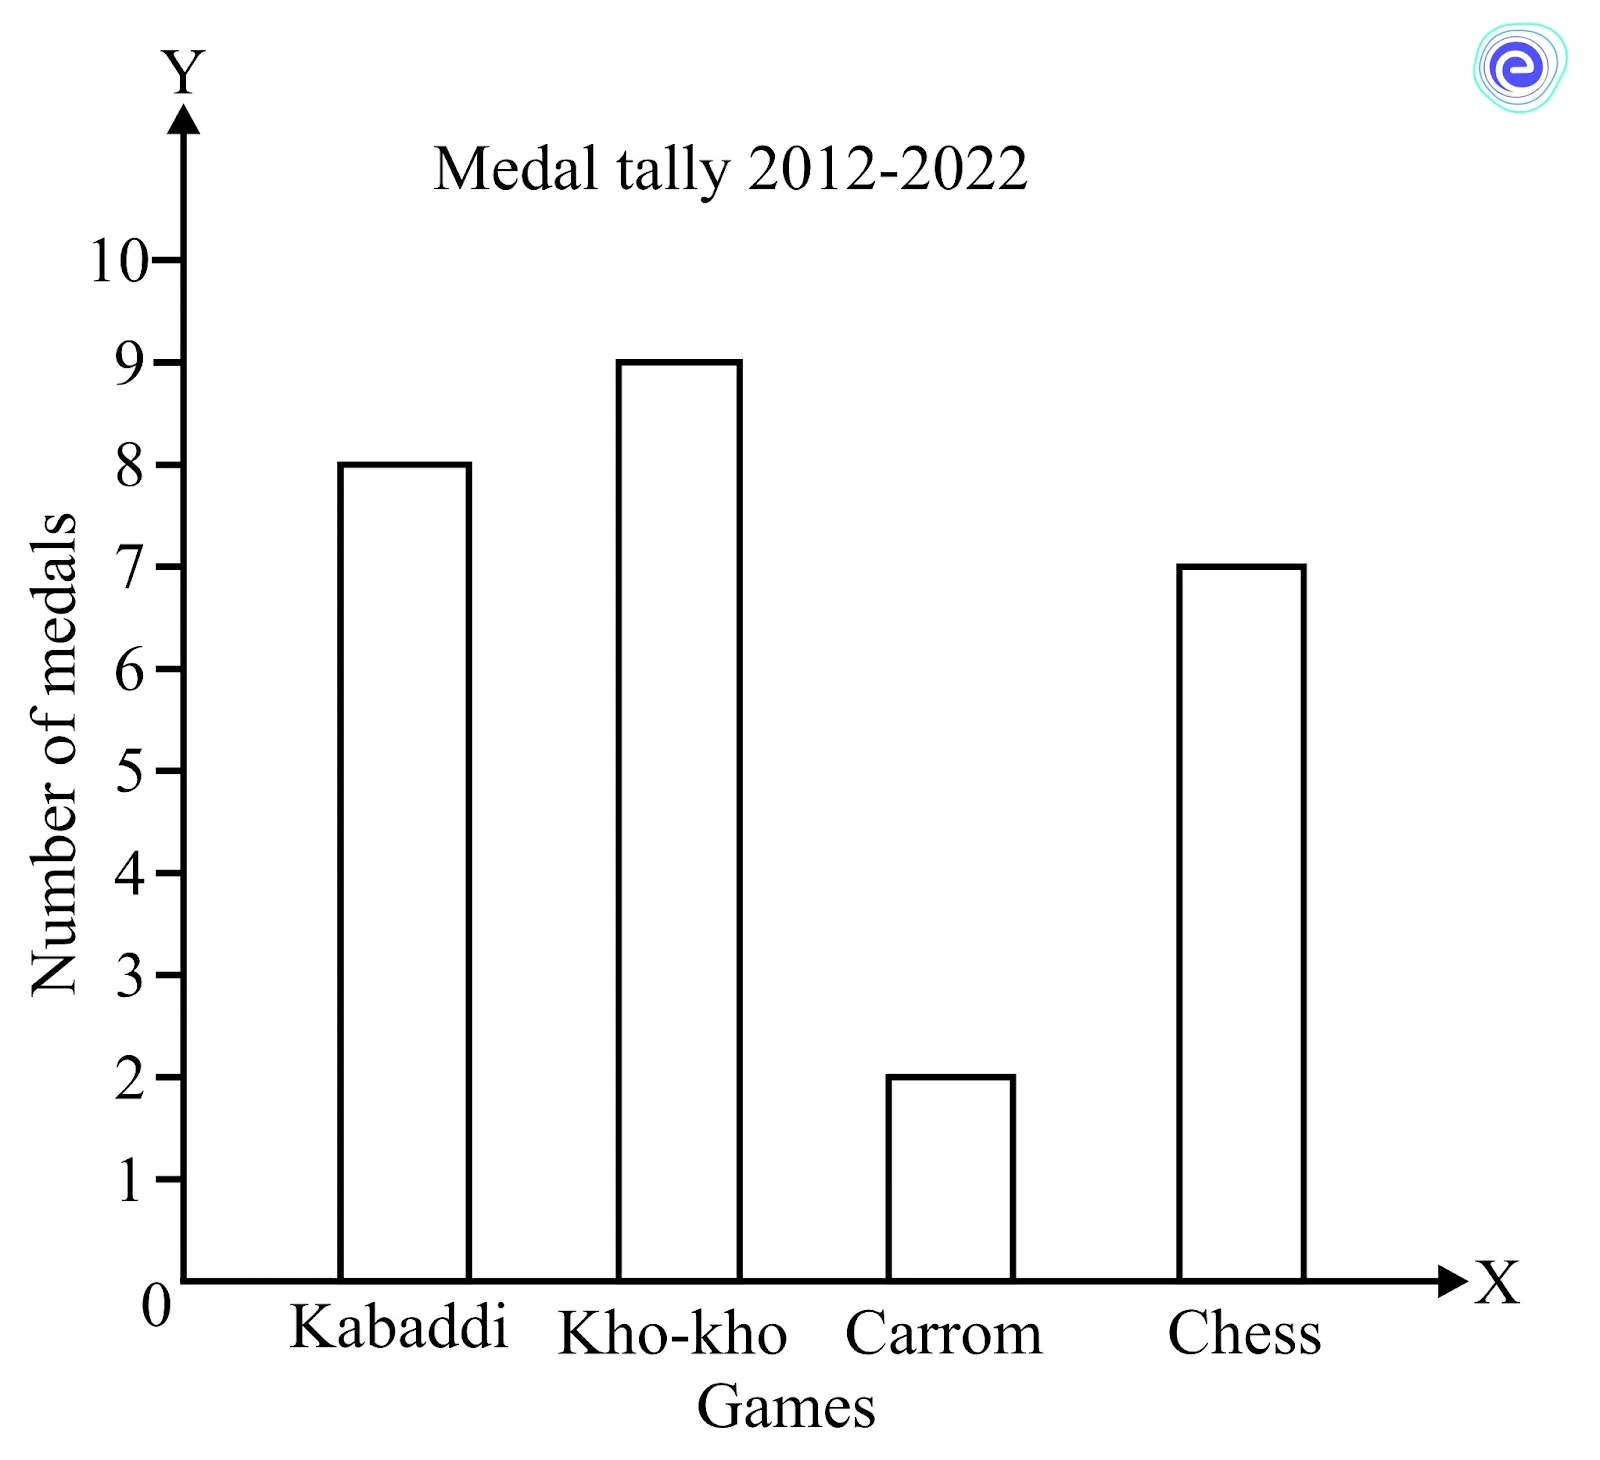 |
| Line Graph | 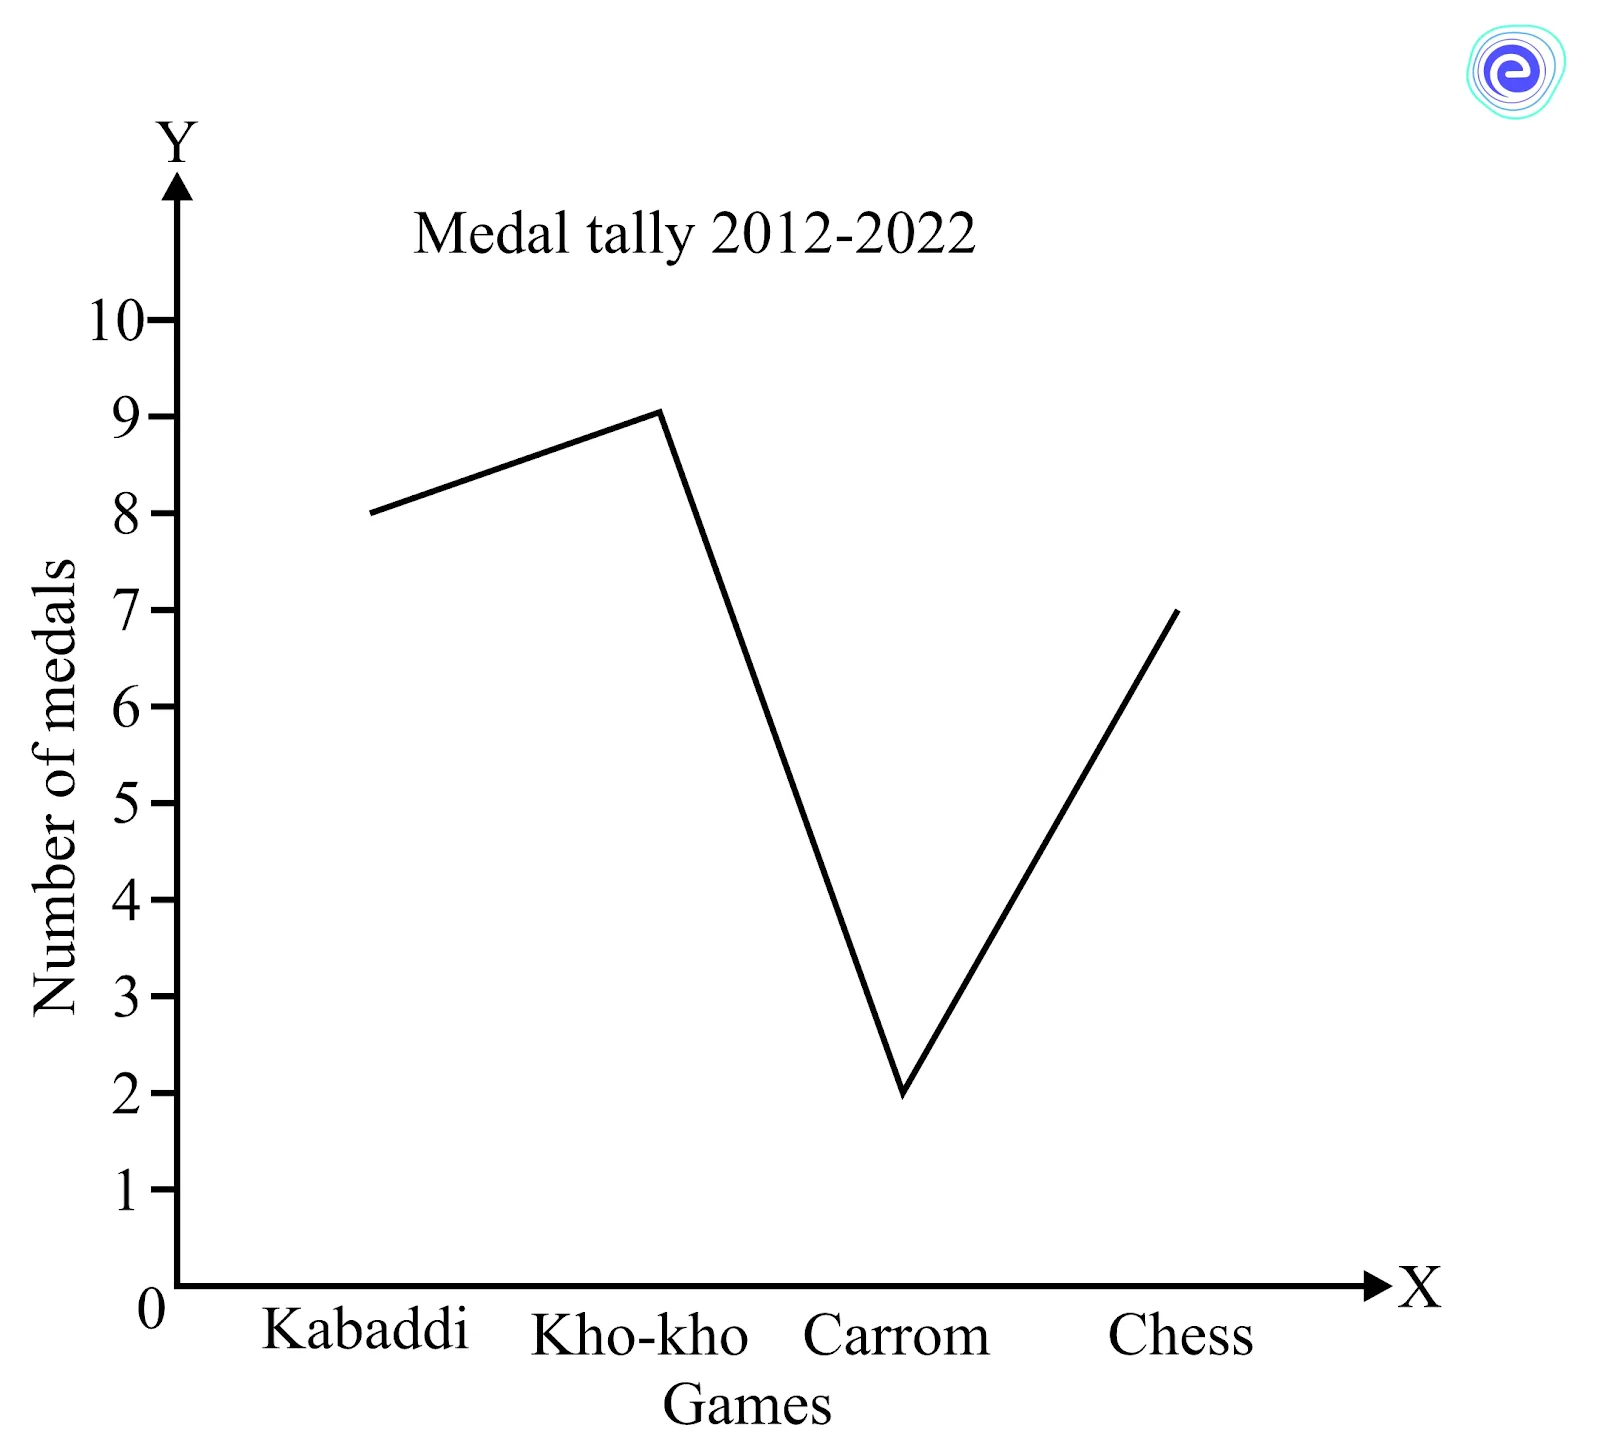 |
| Pie Chart | 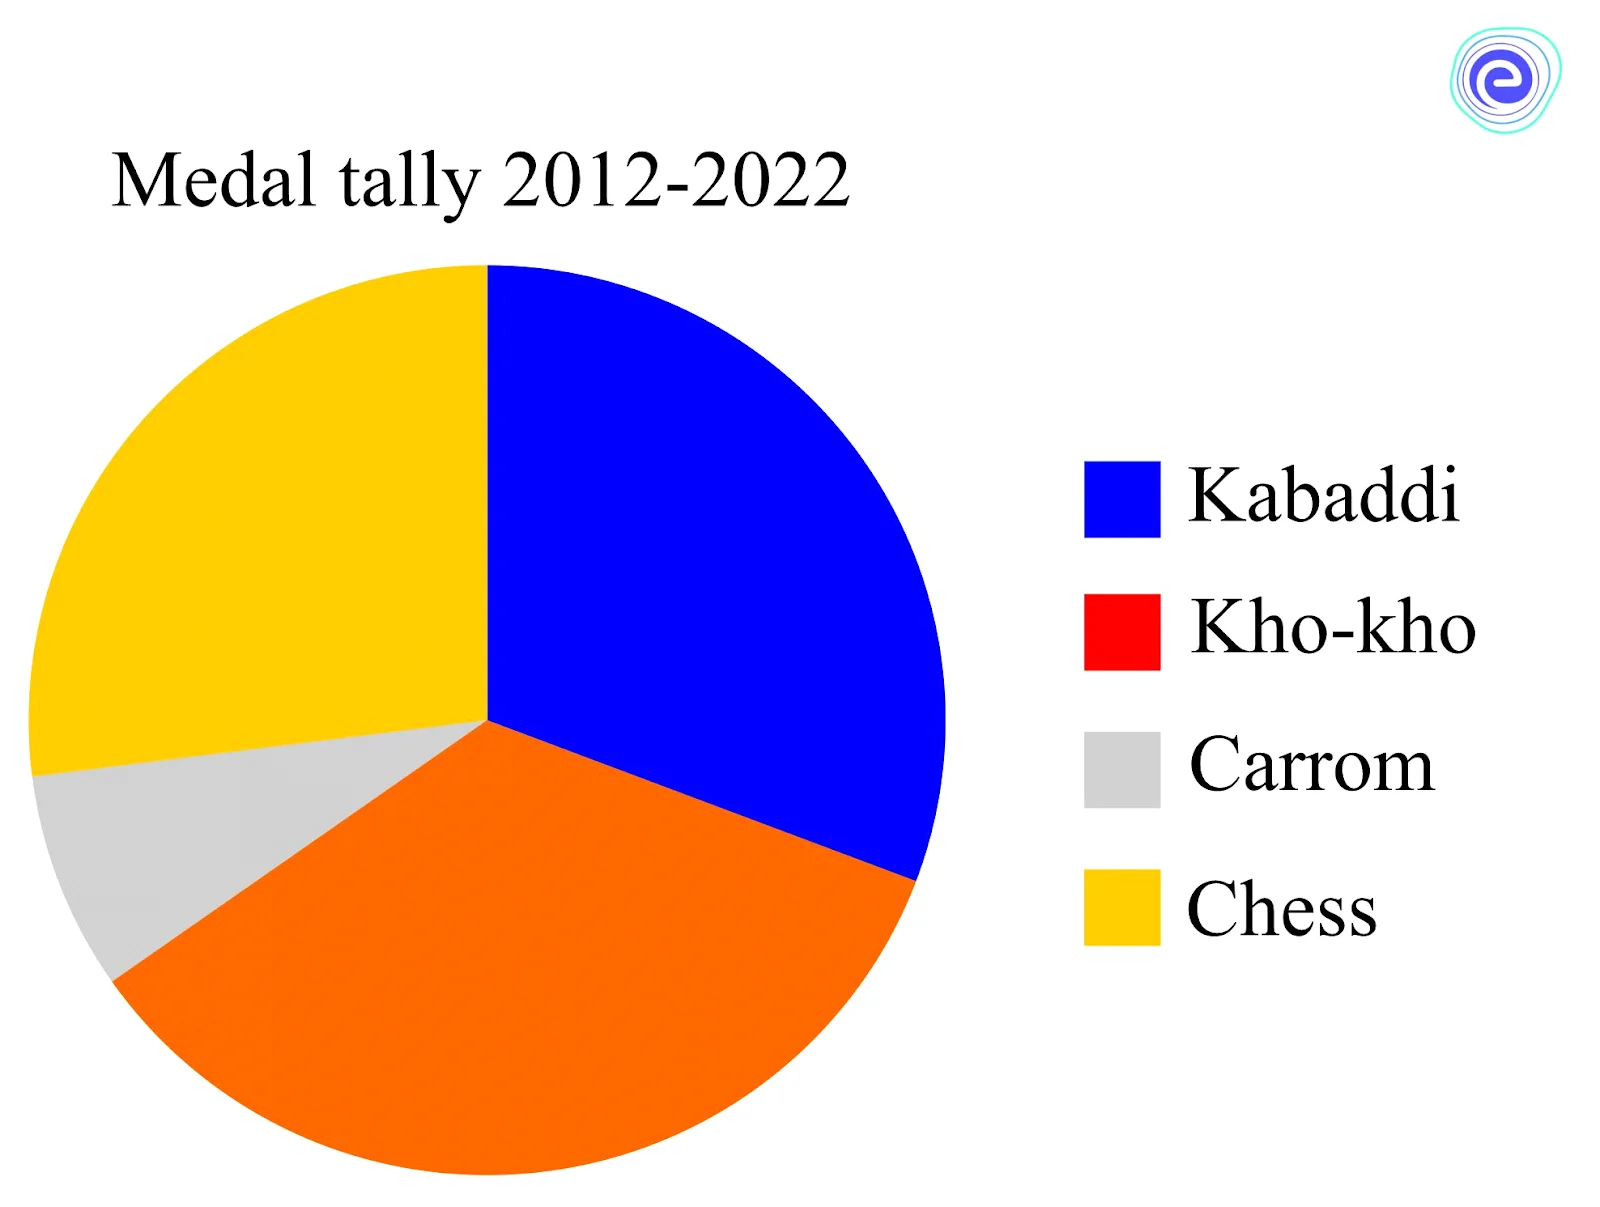 |
We know that a picture is worth a thousand words, which is true even in the case of data presentation.
One more benefit of data presentation is that even a person who is not an expert in a particular topic can understand data easily. Data presentation finds wide applications in industries, agriculture, and schools.
Sometimes we need to work with the data to obtain specific information that will help us make decisions. One such method is finding a single number representing the entire data set. This single number can be the mean, median, or mode of a data set. One more method is finding the variation in the data set. The number used to estimate the variation in the data set is called standard deviation.
Following the data, handling steps helps us make informed decisions in real-life situations like making bus/train schedules and timetables.
PRACTICE EXAM QUESTIONS AT EMBIBE
Here are a few solved examples which will help you understand.
Q.1. The number of students absent for \(30\) days is as follows. Arrange these numbers in a table using tally marks. \(8,\;1,\;3,\;7,\;6,\;5,\;5,\;4,\;4,\;2,\;4,\;9,\;5,\;3,\;7,\;1,\;6,\;5,\;2,\;7,\;7,\;3,\;8,\;4,\;2,\;8,\;9,\;5,\;8,\;6\)
(a) Find the number of days more than \(7\) students were absent.
(b) How many days saw the number of absent students below \(4\)?
Solution:
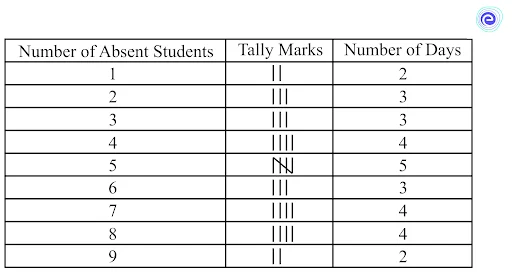
(a) Number of days on which more than \(7\)students were absent \( = \) number of days on which \(8\) students were absent \(+\) number of days on which \(9\) students were absent
\(\therefore \) Number of days on which more than \(7\) students were absent \( = 4 + 2 = 6\)
(b) Number of days on which less than \(4\) students were absent \( = \) Number of days on which student was absent \(+\) Number of days on which \(2\) students were absent \(+\) Number of days on which \(3\)students were absent
\(\therefore \)Number of days on which less than students were absent \( = 2 + 3 +3= 8\)
Q.2. Following pictograph shows the number of cycles in five buildings in a town in Rajasthan.

Answer the following questions based on this pictograph.
(i) Which building has the minimum number of cycles?
(ii) What are the maximum number of cycles in a single building and the building that has maximum cycles?
(iii) How many more cycles do building \(Y\) have as compared to building \(Q\).
(iv) What is the total number of cycles in all the buildings?
Solution:
(i) Building \(X\) has the minimum number of cycles.
(ii) The maximum number of cycles in a single building is \(8\), and it is building \(C\) with the maximum number of cycles.
(iii) The number of cycles in building \(Y\) is \(6\), and that in building Q is \(5\). Thus, building Y has \(1\) cycle more than building \(Q\).
(iv) The total number of cycles in all the buildings \(=6+5+8+3+6=28\)
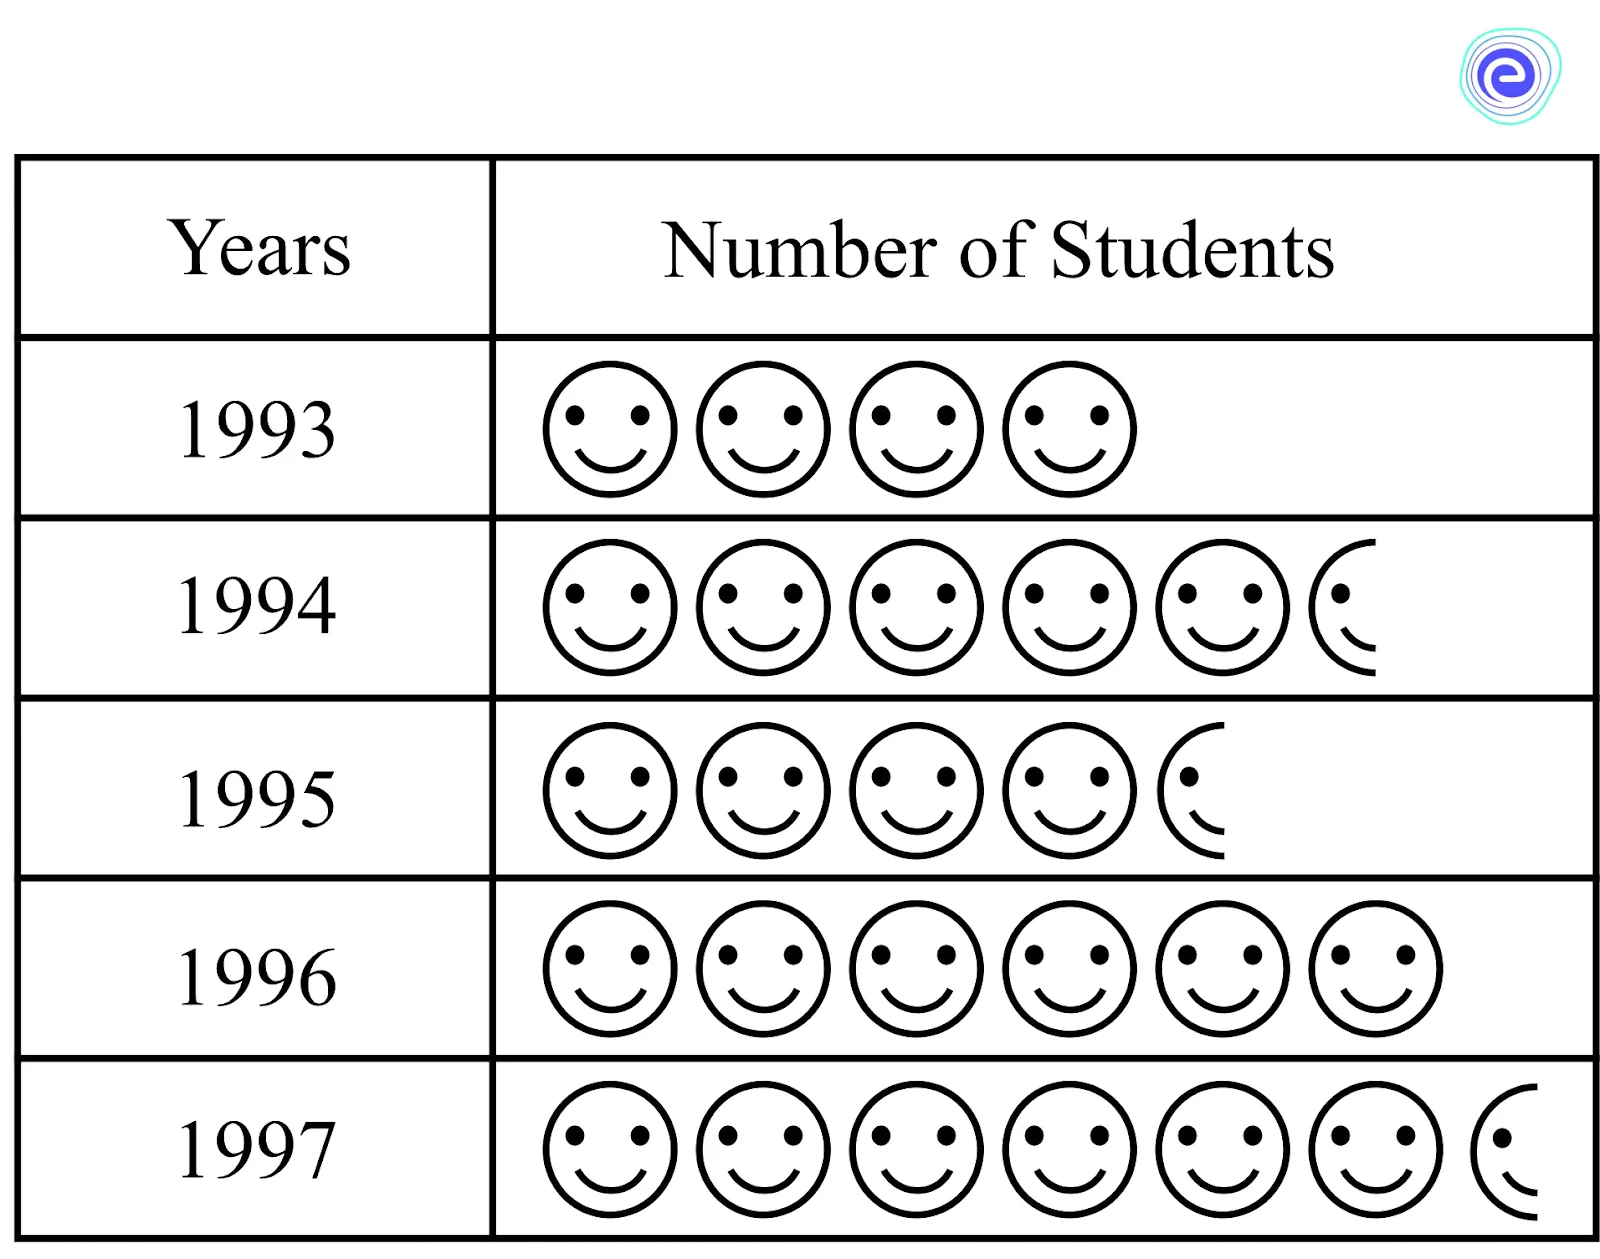
Q.3. The total number of school students for five years is shown in the following table.
| Years | Number of Students |
| \(1993\) | \(400\) |
| \(1994\) | \(535\) |
| \(1995\) | \(472\) |
| \(1996\) | \(600\) |
| \(1997\) | \(623\) |
Prepare a pictograph of students using one smiley symbol as shown below to represent \(100\) students and answer the following questions:
(a) How many symbols represent the total number of students in the year \(1996\)?
(b) How many symbols represent the total number of students for the year \(1994\)?

Solution:
One smiley symbol represents \(100\) students. Hence, we can easily represent the numbers for \(1993\) and \(1996\) by \(4\) and \(6\) symbols respectively.

Q.4. This bar graph shows the sale of mobile phones from June to November.
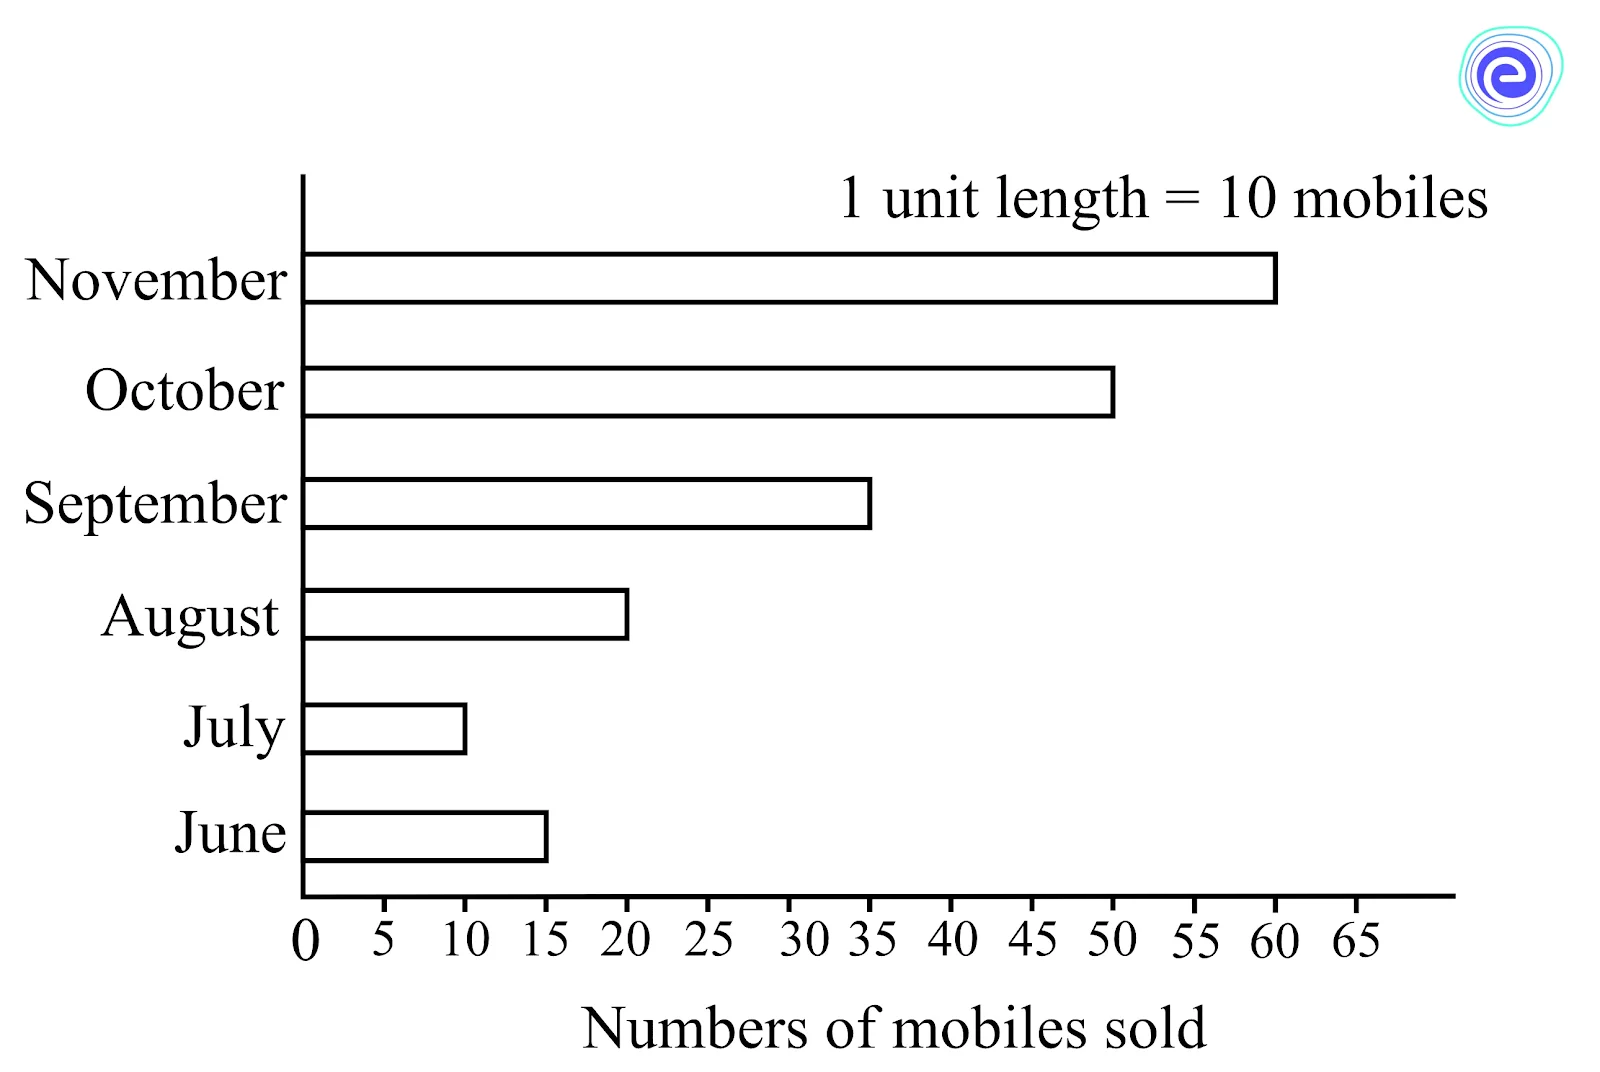
Now answer the following questions:
(a) What scale is chosen on the horizontal line representing the number of mobiles?
(b) In which month was the maximum number of mobiles sold? How many mobiles were sold in that month?
(c) In which month was the minimum number of mobiles sold?
(d) How many mobiles were sold in September?
Solution:
(a) The scale chosen on the horizontal line representing the number of mobiles is \(1\) unit length\(=\) mobiles.
(b) The maximum number of mobiles were sold in November. \(600\) mobiles were sold in November.
(c) The minimum number of mobiles were sold in July.
(d) \(350\) mobiles were sold in September.
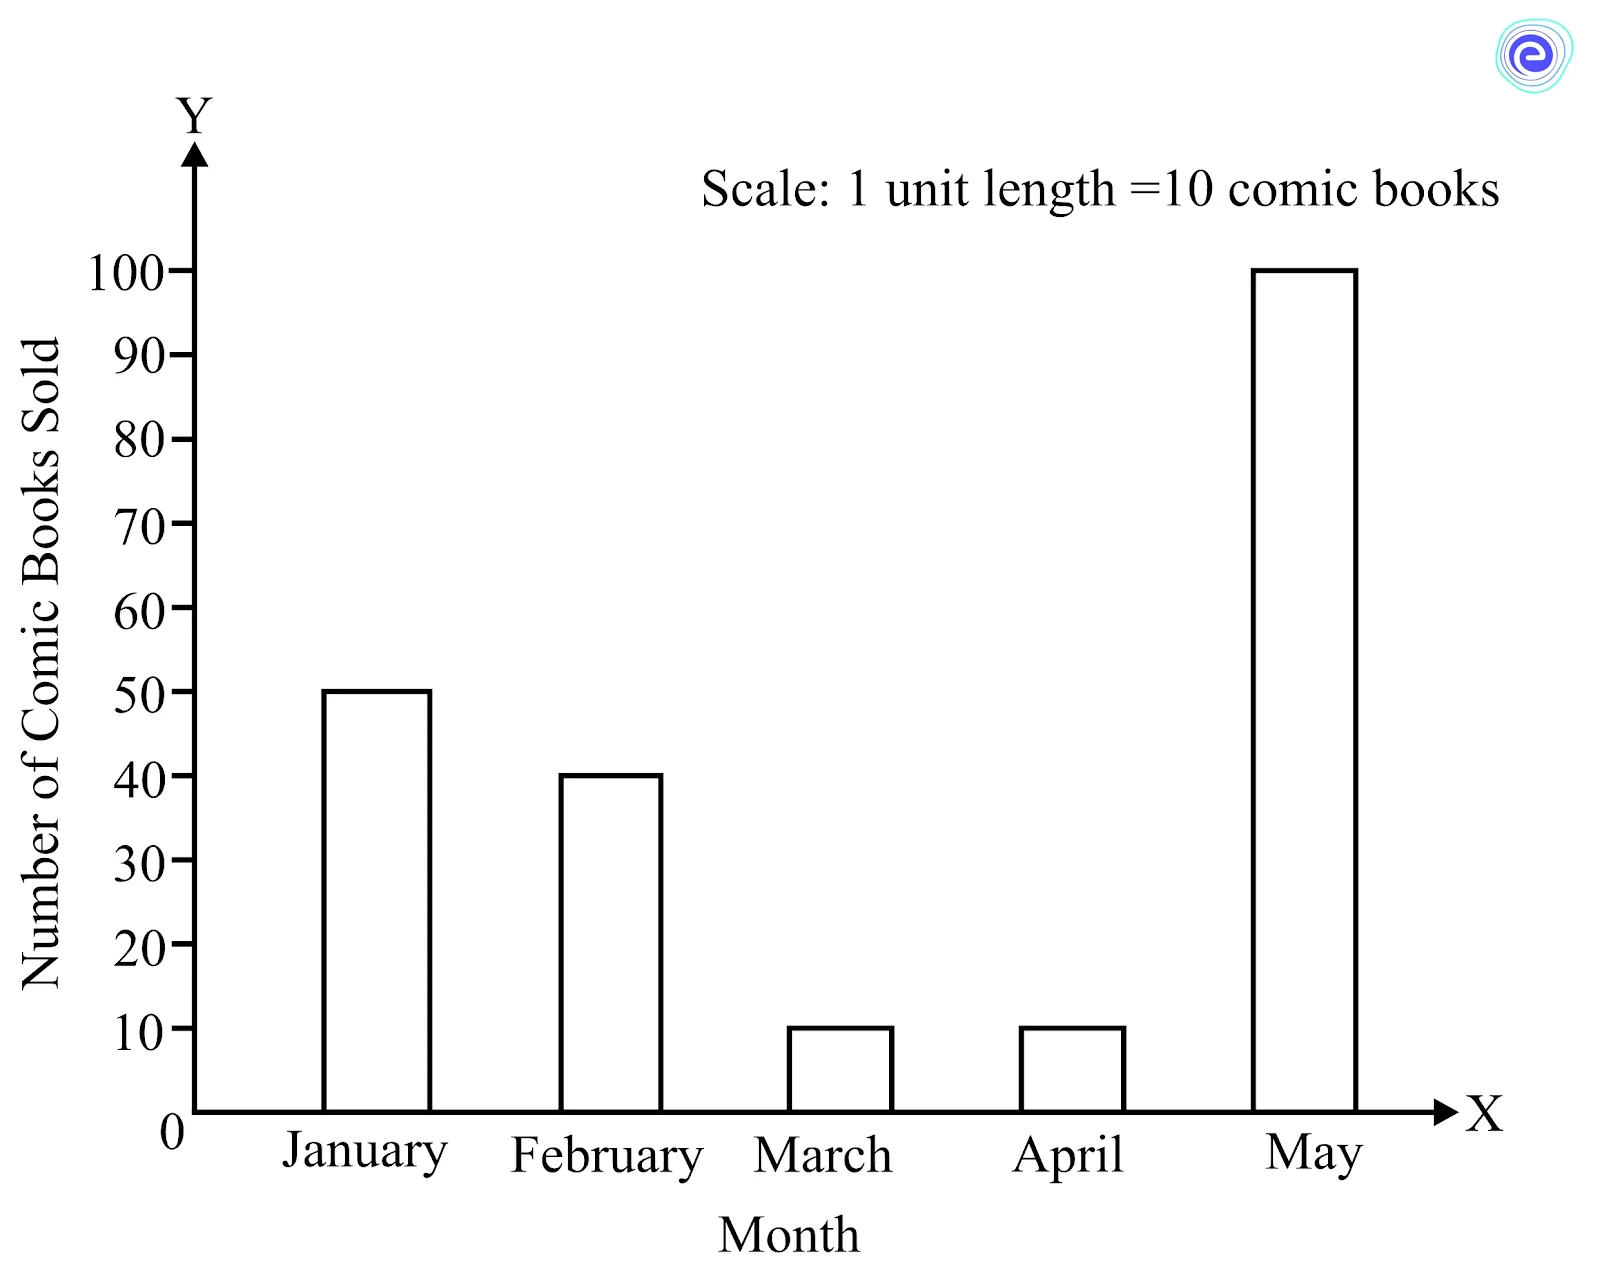
Q.5. The number of comic books sold by a shopkeeper from January to May is shown below:
| Month | January | February | March | April | May |
| Number of Comic Books Sold | \(50\) | \(40\) | \(10\) | \(10\) | \(100\) |
Choosing the scale of your choice, represent the above information on a bar graph.
Solution:
Since all the number of books are multiples of \(10\), we can choose a scale \(1 unit length=10 comic books\).
We now mark numbers from \(1\) to \(10\) on the \(Y\)-axis and the months January to May on \(X\)-axis.
Now we can draw bars of lengths as per the number of comic books in that month.
| Month | Number of Comic Books Sold | Length of the Bar |
| January | \(50\) | \(5\) units |
| February | \(40\) | \(4 \) units |
| March | \(10\) | \(1\) units |
| April | \(10\) | \(1\) units |
| May | \(100\) | \(10\) units |
The graph would be as shown below.
Data by itself does not help or say anything. To extract information from a given data, we need to work on it. We need to organise it and make it presentable to draw proper conclusions from it. Data handling is the process that involves recording the data, organising it, presenting it, and analysing it to make informed decisions. Data can be organised using tally marks or numbers.
Data is presented graphically using several methods such as pictographs, bar graphs, and pie charts. Data is analysed to find a data set’s mean, median, mode, and standard deviation. Data handling is commonly used to keep records of books in libraries and to record water levels in water bodies across the state.

Here are a few common FAQs which usually crop up in the minds of students:
Q.1. What is data handling?
Ans: Data handling is utilising raw data to make it more presentable and to analyse the data so that it becomes easier to make informed decisions.
Q.2. Why is the organisation of data required?
Ans: Raw data is generally in repetitive form, and many times it is not in the form of numbers. The organisation of data helps users to bring the data in a proper numerical form.
Q.3. What are the different methods to present data graphically?
Ans: There are different methods to present data graphically. Some of them are bar graphs, line graphs, pictographs, and pie charts.
Q.4. What is the use of data analysis?
Ans: Data analysis helps us find a representative number for a data set in the form of mean, median or mode and a measure of the variation of a data set in the form of standard deviation.
Q.5. Why do we draw graphs when pictographs give the same information?
Ans: Pictographs involve drawing symbols in place of numbers. When drawing graphs, we can draw lines or bars to show the same numbers, which is easier than pictographs.
We hope this article on Introduction to Data Handling proved to be helpful and informative. For more such articles stay tuned to embibe.com.


