


Uses of Boron and Aluminium and Their Compounds: Boron and Aluminium belong to the \({\rm{p}}\) block of the periodic table and are in the \({13^{{\rm{th}}}}\)...
Last Modified 13-04-2025

Harvest Smarter Results!
Celebrate Baisakhi with smarter learning and steady progress.
Unlock discounts on all plans and grow your way to success!

Uses of Boron and Aluminium and Their Compounds
April 13, 2025
Occurrence of Group 16 Elements: Different Elements, Properties, and Uses
March 31, 2025
Skin Derivatives: Epidermis, Dermis, Hair, Nail and Glands
March 30, 2025
Breathing in Other Animals: Meaning, and Respiratory Organs
March 23, 2025
Geometry and Locus: Loci of Geometrical Figures, Shapes
March 22, 2025
NCERT Book for Class 10 History 2025: Download PDF
February 27, 2025
CBSE Class 10 Notes 2025 – Check Here
February 27, 2025
CBSE Class 10 Maths Sample Paper 2025: PDF Download
February 27, 2025
NCERT Books For Class 10 Science 2025: Download PDF
February 20, 2025
NCERT Books for Class 10 2025: Download PDF
February 17, 2025
Moving averages: You may have heard a reporter say that the temperature in a particular city or country has broken a record while watching the news. Some states’ or countries’ rainfall has set a new standard. How did they find out about it? What steps have they taken, and what studies have they conducted to support this claim? It is time-series data. You’re all familiar with time-series data and its various components.
A moving average is a technical indicator that market analysts and investors can use to predict the direction of a trend. It averages the financial security data points over a given time period by adding all the data points and dividing this total by the number of data points. It is the sum of any subset of numbers.

A moving average is a fantastic tool for forecasting long-term trends. It can be calculated for any period. A moving average is so named because it is constantly recalculated using the latest price data.
Long-term fluctuations, short-term or periodic fluctuations, and random variations are the three broad categories of time series. A long-term variation or trend depicts the general tendency of data to increase or decrease over time. The change may be gradual, but it is unavoidable.
The middle value of a set of numbers is its average. The moving average is the same, but it is calculated several times for different subsets of the data. This method employs the concept of smoothing out data fluctuations through mean of the data. It calculates the trend by removing changes or variations using a moving average. The simplest type of mean used to measure a trend is the arithmetic mean (averages).
Analysts use moving averages to examine support and resistance by analysing an asset’s price movements. A moving average reflects the previous price movement of a security. The data is used by analysts or investors to forecast the future direction of that asset price. It is said to be a lagging indicator because it produces a signal or indicates the direction of a given trend after the price action of the underlying asset.
Below are the different types of Moving Averages and explained in detail.
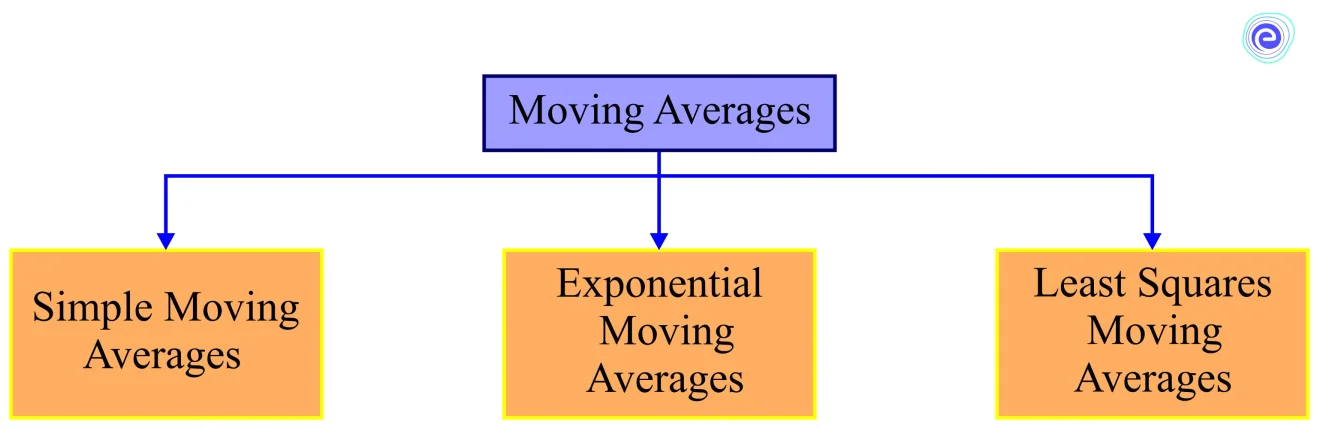
The simple moving average (SMA) is the most basic moving average, calculated by adding the most recent data points in a set and then dividing the total by the number of time periods.
Traders use the SMA indicator to generate signals about when to enter or exit a stock.
An SMA is a lagging indicator because it is based on past price data for a given period and can be computed for various price types like high/low, open, and close.
This average is used by traders to determine to buy and sell signals for securities and identify support and resistance zones.
The formula given below is used for calculating the simple moving average.
\(SMA = \frac{{\left( {{A_1} + {A_2} + \ldots \ldots \ldots {A_n}} \right)}}{n}\)
Where:
\(A\) is the average in period
\(n\) is the number of periods
The next type of moving average is the exponential moving average (EMA), which gives more weight to the most recent or latest price points and makes it more responsive to recent data points.
In comparison to the SMA, the EMA is more responsive to recent price changes because it assigns the same weight to all price changes in the given time period.
Three steps are involved when calculating EMA:
\({\rm{Current}}\,{\rm{EMA}} = [{\rm{Closing}}\,{\rm{Price}} – {\mathop{\rm EMA}\nolimits} ({\rm{Previous}}\,{\rm{Time}}\,{\rm{Period}})] \times {\rm{Multiplier}}\)
\( + {\rm{EMA}}\left( {{\rm{Previous}}\,{\rm{Time}}\,{\rm{Period}}} \right)\)

The least-square moving average (LSMA) computes the least-squares regression line for previous time periods, resulting in forward projections from the current period. The indicator aids in determining what might happen if the regression line is followed.
The indicator uses the sum of least squares method to find the straight line that best fits the data for the given period.
PRACTICE EXAM QUESTIONS AT EMBIBE
Below are a few solved examples that can help in getting a better idea.
Q.1. A stock trader wants to calculate a stock’s simple moving average by taking its closing price over the last five days. The closing prices for the last \(5\) days are as follows:
\({\rm{₹23, ₹23}}{\rm{.40, ₹23}}{\rm{.20,}}\,{\rm{₹24}}\) and \({\rm{₹25}}{\rm{.50}}\) Find the simple moving average.
Ans: The formula to calculate a simple moving average is
\(SMA = \frac{{(₹23 + ₹23.40 + ₹23.20 + ₹24 + ₹25.50)}}{5}\)
Hence, SMA \( = ₹23.82\)
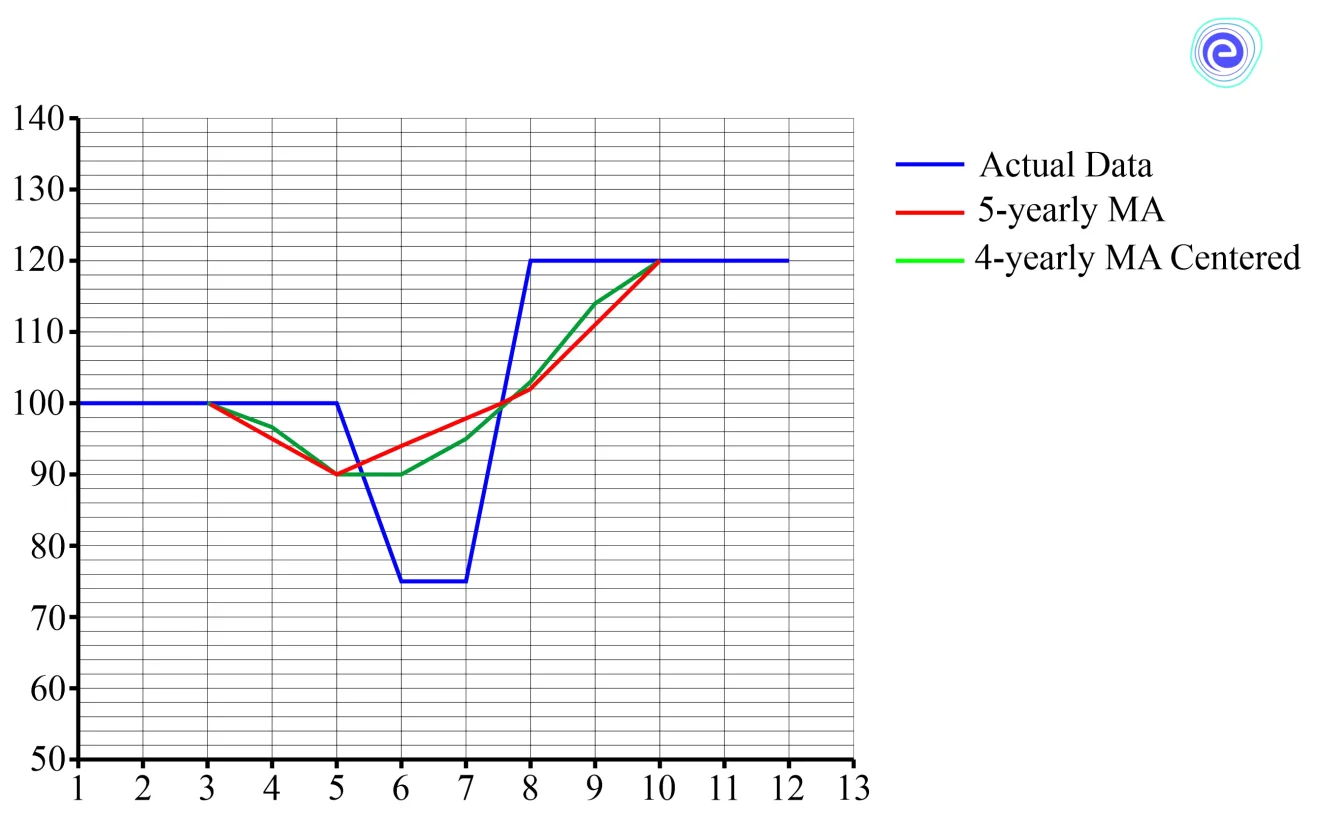
Q.2. Calculate the \(4\)-yearly and \(5\)-yearly moving averages for the given data of the increase \({I_i}\) in the population of a city for \(12\) years. Make a graphic representation of it.
\({I_i} = \left\{ {\begin{array}{*{20}{c}}{100;\,t = 1,\,2,\, \ldots ,\,5}\\{75;\,t = 6,\,7}\\{120;\,t = 8,\,9,\, \ldots ,\,12}\end{array}} \right\}\)
Ans:
| \(t\) | \({I_i}\) | \(5\)-yearly moving totals | \(5\)-yearly moving averages | \(4\)-yearly moving totals (not centred) | \(4\)-yearly moving average (not centred) | \(2\)-period moving total (centred) | \(4\)-yearly moving average (centred) |
| \((1)\) | \((2)\) | \((3)\) | \(\left( 4 \right) = (3) \div 5\) | \((5)\) | \(\left( 6 \right) = (5) \div 4\) | \((7)\) | \(\left( 8 \right) = (7) \div 2\) |
| \(1\) | \(100\) | \(-\) | \(-\) | \(-\) | \(-\) | \(-\) | \(-\) |
| \(2\) | \(100\) | \(-\) | \(-\) | \(-\) | \(-\) | \(-\) | \(-\) |
| \(-\) | \(-\) | \(400\) | \(100\) | \(-\) | \(-\) | ||
| \(3\) | \(100\) | \(500\) | \(100\) | \(-\) | \(200\) | \(100\) | |
| \(-\) | \(-\) | \(400\) | \(100\) | \(-\) | \(-\) | ||
| \(4\) | \(100\) | \(475\) | \(95\) | \(-\) | \(193.75\) | \(96.875\) | |
| \(-\) | \(-\) | \(375\) | \(93.75\) | \(-\) | \(-\) | ||
| \(5\) | \(100\) | \(450\) | \(90\) | \(-\) | \(181.25\) | \(90.625\) | |
| \(-\) | \(-\) | \(350\) | \(87.50\) | \(-\) | \(-\) | ||
| \(6\) | \(75\) | \(470\) | \(94\) | \(-\) | \(-\) | \(180\) | \(90\) |
| \(-\) | \(-\) | \(370\) | \(92.50\) | \(-\) | \(-\) | ||
| \(7\) | \(75\) | \(490\) | \(98\) | \(-\) | \(190\) | \(95\) | |
| \(-\) | \(-\) | \(390\) | \(97.50\) | \(-\) | \(-\) | ||
| \(8\) | \(120\) | \(510\) | \(102\) | \(-\) | \(-\) | \(206.25\) | \(103.125\) |
| \(-\) | \(-\) | \(435\) | \(108.75\) | \(-\) | \(-\) | ||
| \(9\) | \(120\) | \(555\) | \(111\) | \(-\) | \(-\) | \(228.75\) | \(114.375\) |
| \(-\) | \(-\) | \(480\) | \(120\) | \(-\) | \(-\) | ||
| \(10\) | \(120\) | \(600\) | \(120\) | \(-\) | \(-\) | \(240\) | \(120\) |
| \(-\) | \(-\) | \(480\) | \(120\) | \(-\) | \(-\) | ||
| \(11\) | \(120\) | \(-\) | \(-\) | \(-\) | \(-\) | \(-\) | \(-\) |
| \(12\) | \(120\) | \(-\) | \(-\) | \(-\) | \(-\) | \(-\) | \(-\) |
The four-year moving averages are centred in this case so that the moving average coincides with the original time period. It is accomplished by dividing the two-period moving totals by two, i.e., taking their average. The above data set’s moving averages are represented graphically as shown below.
Q.3. Compute \(5\)-year, \(7\)-year and \(9\)–year moving averages for the following data.
| Years | \(1990\) | \(1991\) | \(1992\) | \(1993\) | \(1994\) | \(1995\) | \(1996\) | \(1997\) | \(1998\) | \(1999\) | \(2000\) |
| Value | \(2\) | \(4\) | \(6\) | \(8\) | \(10\) | \(12\) | \(14\) | \(16\) | \(18\) | \(20\) | \(22\) |
Ans:
The necessary calculations required to find the moving average are given below:
| \(5\)-Year Moving | \(7\)-Year Moving | \(9\)-Year Moving | |||||
| Years | Value | Total | Average | Total | Average | Total | Average |
| \(1990\) | \(2\) | \(-\) | \(-\) | \(-\) | \(-\) | \(-\) | \(-\) |
| \(1991\) | \(4\) | \(-\) | \(-\) | \(-\) | \(-\) | \(-\) | \(-\) |
| \(1992\) | \(6\) | \(30\) | \(6\) | \(-\) | \(-\) | \(-\) | \(-\) |
| \(1993\) | \(8\) | \(40\) | \(8\) | \(56\) | \(8\) | \(-\) | \(-\) |
| \(1994\) | \(10\) | \(50\) | \(10\) | \(70\) | \(10\) | \(90\) | \(10\) |
| \(1995\) | \(12\) | \(60\) | \(12\) | \(84\) | \(12\) | \(108\) | \(12\) |
| \(1996\) | \(14\) | \(70\) | \(14\) | \(98\) | \(14\) | \(126\) | \(14\) |
| \(1997\) | \(16\) | \(80\) | \(16\) | \(112\) | \(16\) | \(-\) | |
| \(1998\) | \(18\) | \(90\) | \(18\) | \(-\) | \(-\) | \(-\) | \(-\) |
| \(1999\) | \(20\) | \(-\) | \(-\) | \(-\) | \(-\) | \(-\) | \(-\) |
| \(2000\) | \(22\) | \(-\) | \(-\) | \(-\) | \(-\) | \(-\) | \(-\) |
Q.4. The temperatures measured for the first week in July were as follows:
\({21^{\rm{o}}}{\rm{C,}}\,{24^{\rm{o}}}{\rm{C,}}\,{21^{\rm{o}}}{\rm{C,}}\,{27^9}{\rm{C,}}\,{\rm{3}}{0^{\rm{o}}}{\rm{C,}}\,{28.5^{\rm{o}}}{\rm{C}}\) and \(36^{\rm{o}}{\rm{C}}\)
Calculate the 3-point moving averages and describe the trend.
Ans:
\({\rm{(21 + 24 + 21) \div 3 = 2}}{{\rm{2}}^{\rm{o}}}{\rm{C}}\)
\((24 + 21 + 27) \div 3 = {24^{\rm{o}}}{\rm{C}}\)
\((21 + 27 + 30) \div 3 = {26^{\rm{o}}}{\rm{C}}\)
\((27 + 30 + 28.5) \div 3 = {28.5^{\rm{o}}}{\rm{C}}\)
\((30 + 28.5 + 36) \div 3 = {31.5^{\rm{o}}}{\rm{C}}\)
So we got the \(3\)-point moving averages like \({\rm{22,}}\,{\rm{24,}}\,{\rm{26,}}\,{\rm{28}}{\rm{.5}}\) and \({\rm{31}}{\rm{.5}}\).
The moving averages are increasing, and hence the general trend is that the temperatures are rising through the week.
Q.5. A four-period SMA has prices of \(1.2640,\,1.2641,\,1.2642\), and \(1.2641\). Find the moving average.
Ans: Formula for a simple moving average is written as follows:
\(SMA = \frac{{\left( {{A_1} + {A_2} + \ldots \ldots ..{A_n}} \right)}}{n}\)
\( \Rightarrow SMA = \frac{{1.2640 + 1.2641 + 1.2642 + 1.2641}}{4}\)
\(\therefore \,SMA = 1.2641\)
A moving average is a technical indicator that traders and investors use to determine the direction of a trend. To calculate an average, it adds up any financial security data points and then divides the total by the number of data points over the given time period. It is known as the moving average because it is constantly recalculated using the most recent price data. An analyst utilises the moving average to determine the support and resistance by analysing the asset’s price movements. This indicator displays a security’s previous price movement, which traders use to determine the potential direction of the asset price. It is a lagging indicator because it lags behind the price action of any underlying asset to generate a signal or show the price direction of any stock.

Students might be having many questions with respect to the Moving Averages. Here are a few commonly asked questions and answers.
Q.1. How to calculate a simple moving average?
Ans: The formula for Simple Moving Average is written as follows:
\(SMA = \frac{{\left( {{A_1} + {A_2} + \ldots \ldots \ldots {A_n}} \right)}}{n}\)
Where:
\(A\) is the average in period
\(n\) is the number of periods
Q.2. What are the \(6\) moving averages?
Ans: There are \(6\) types of moving averages that traders use when trading in the stock market:
Q.3. Why is moving average important?
Ans: As a lagging indicator, a moving average is primarily used to identify the trend of any financial security rather than providing trading signals. Like other technical indicators, the moving averages should be used in conjunction with other technical tools such as price action or momentum indicators.
Q.4. What is a simple moving average?
Ans: The SMA Is the most basic moving average, calculated by adding the most recent data points in a set and then dividing the total by the number of time periods.
Traders use the SMA indicator to generate signals about when to enter or exit a stock.
An SMA is a lagging indicator because it is based on past price data for a given period and can be computed for various price types such as high, low, open, and close.
Q.5. What are the advantages and disadvantages of the moving average method?
Ans: The simple moving average has the advantage of being smoothed and, as opposed to the EMA, and is less prone to false signals. The disadvantage is that some of the data used to calculate the moving average may be outdated.
We hope this information about the Moving Averages has been helpful. If you have any doubts, comment in the section below, and we will get back to you.


