


IBPS PO Mains Preparation . 738526
Last Modified 26-03-2025

Harvest Smarter Results!
Celebrate Baisakhi with smarter learning and steady progress.
Unlock discounts on all plans and grow your way to success!

IBPS PO Mains Preparation Guidelines
March 26, 2025
IBPS Clerk Login 2025: How to Register and Apply
March 26, 2025
IBPS Clerk Prelims Mock Test 2025: Attempt Online Test Series
March 26, 2025
SSC Selection Post Study Plan 2025 – Check Preparation Strategy
March 26, 2025
SSC Selection Post Exam Centres 2025: State-wise List
March 26, 2025
SSC MTS Sample Papers: Download PDFs
March 25, 2025
IBPS RRB Recruitment Notification 2025 For 5000 + Vacancies | Apply online @ ibps.sifyitest.com
March 18, 2025
SBI PO Mains General Awareness 2025: Check Details
March 15, 2025
SSC GD Important Dates 2025: Check GD Constable Exam Date
March 13, 2025
SSC Selection Post Exam Analysis 2025: Check Difficulty Level
March 13, 2025
Solutions of Linear Inequalities in Two Variables: Equations or equalities are mathematical representations of any two things that are equal. While equalities represent a relationship between two variables, inequalities represent situations that are better described by a range of values instead of a single solution. This means that, mathematically, inequalities have more than one correct answer. Similar to equalities, the graphs of inequalities may broadly be of two types: Linear inequality and nonlinear inequality.
Here, let us focus on linear inequalities and understand how to solve them.

| Symbol of Inequality | Meaning |
| \( \ne \) | Not equal to |
| \( < \) | Lesser than |
| \( > \) | Greater |
| \( \le \) | Less than or equal to |
| \( \ge \) | Greater than or equal to |
In mathematics, linear inequality is defined as a linear function in which two values are compared using the inequality symbols. An inequality is said to be linear if the degree of the polynomial is one.
Example of linear inequalities: For a linear polynomial \(ax + b,\) the inequalities may be \(ax + b \le 0,\,ax + b \ge 0,\) or \(ax + b \ne 0,\) where \(a\) and \(b\) are real numbers.The common method to solve inequalities is by graphing them.

On the other hand, for a linear inequality in two variables, the solution set is a region that defines a part of the coordinate plane.
Now take a look at the following graphs of inequalities.
| \(x + y < 2\) | \(x + y > 2\) |
 |  |
| \(x + y \le 2\) | \(x + y \ge 2\) |
 |  |
Observe that the line, either dotted or solid. This line serves as a boundary on one side, while the region extends infinitely on other sides. This shows that any point that lies in the shaded region will satisfy the inequality.
Let us verify this using a sample point for each of these inequalities.
| Linear Inequality | Test Point from the Shaded Region | Validity |
| \(x + y < 2\) | \(\left( { – 2,\, – 2} \right)\) | \( – 2 + \left( { – 2} \right) < 2\) \( – 4 < 2\) Lies in the region |
| \(x + y > 2\) | \(\left( {3,\,3} \right)\) | \(3 + 3 > 2\) \(6 > 2\) Lies in the region |
| \(x + y \le 2\) | \(\left( {0,\,0} \right)\) | \(0 + 0 \le 2\) \(0 \le 2\) Lies in the region |
| \(x + y \ge 2\) | \(\left( {3,\,3} \right)\) | \(3 + 3 \ge 2\) \(6 \ge 2\) Lies in the region |
What about the points that lie on the line?
Take a closer look at these two graphs.
| \(x + y < 2\) | \(x + y \le 2\) |
 |  |
| Non-inclusive Boundary | Inclusive Boundary |
You will see that the line is dotted in the first graph, while it is solid in the second. The dotted line represents a non-inclusive boundary, and the solid line represents an inclusive boundary.
The graph of a linear inequality is always a region, as shown in the graphs. However, the inclusion or exclusion of the line depends on the type of inequality. For a strict inequality like \( < \) or \( > ,\) the line is not included in the solution set and is represented by a dotted line. Whereas, for a slack inequality like \( \le \) or \( \ge ,\) the line is included in the solution set and is represented by a solid line.| Test Point | \(x + y < 2\) | \(x + y \le 2\) |
| \(\left( {4,\, – 2} \right)\) | \(4 + \left( { – 2} \right) < 2\) \(2 < 2\) Not a valid point. | \(4 + \left( { – 2} \right) < 2\) \(2 \le 2\) Valid point. |
Step 1: Make the inequality into equality by changing the inequality symbol to \( = .\)
Step 2: Identify two or more points, and use the points to plot the linear graph.
a. For strict inequality such as \( \le \) and \( \ge ,\) use a solid line.
b. For slack inequality such as \( < \) and \( > ,\) use a dotted line.
Step 3: Use a test point that does not lie on the line to check if it satisfies the inequality. Use this to shade the solution set.
a. If the inequality is satisfied, shade the half-plane that has the test point.
b. If the inequality is not satisfied, shade the half-plane that does not have the test point.
A system of linear inequalities in two variables includes more than one linear inequality in the same variables. A system of linear inequalities will look like this:
\({a_{11}}{x_1} + {a_{12}}{x_2} + {a_{13}}{x_3} + …. +{a_{1n}}{x_n} < {b_1}\)

Q.1. Solve: \(x + 9y < 27.\)
Ans: \(x + 9y < 27\)
\(9y < 27 – x\)
\(y < 3 – \frac{x}{9}\)
| When \(x = 0\) | When \(y = 0\) |
| \(0 + 9y < 27\) \(y < \frac{{27}}{9}\) \(y < 3\) | \(x + 9\left( 0 \right) < 27\) \(x + 0 < 27\) \(x < 27\) |
| \(\left({0,3} \right)\) | \(\left({27,0} \right)\) |
Q.2. Graph the solution set of \(3x + y > 1.\)
Ans: \(3x + y > 1.\) can be written an \(y > 1 – 3x\)
| \(x\) | \(0\) | \(1\) | \( – 1\) |
| \(y\) | \(y > 1 – 3\left( 0 \right)\) \(y > 1\) | \(y > 1 – 3\left( 1 \right)\) \(y > – 2\) | \(y > 1 – 3\left({ – 1} \right)\) \(y > 4\) |
| \(x,y\) | \(\left({0,1} \right)\) | \(\left({1, – 2}\right)\) | \(\left({ – 1,4} \right)\) |
Since this is a slack inequality, we mark the graph with a dotted line.


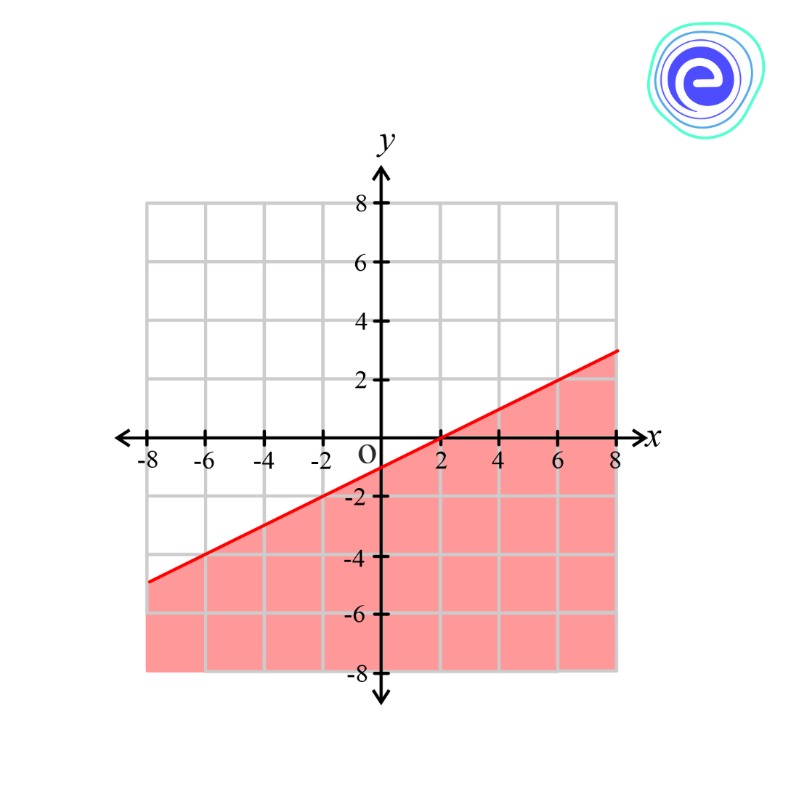
Q.3. Brook’s mother hands over \(₹7\) to him for chocolates. A milk chocolate costs \(₹2\) while a nuts chocolate costs \(₹3.\) Let x be the number of milk chocolates and y be the number of nuts chocolates. Form an inequality corresponding to the above situation and graph the inequality.
Ans: Cost of milk chocolates \( = 2x\)
Cost of nuts chocolates \( = 3y\)
Total amount in hand \(=₹ 7\)
\(\therefore \) Cost inequality \( = 2x + 3y \le 7\)
\( \Rightarrow 3y \le 7 – 2x\)
\( \Rightarrow y \le \frac{{7 – 2x}}{3}\)
| \(x\) | \(0\) | \(2\) | \( – 1\) |
| \(y \le \frac{{7 – 2x}}{3}\) | \(y \le \frac{{7 – 2\left( 0 \right)}}{3}\) \(y \le \frac{{7 – 0}}{3}\) \(y \le \frac{7}{3}\) \(y \le 2.3\) | \(y \le \frac{{7 – 2\left( 2 \right)}}{3}\) \(y \le \frac{{7 – 4}}{3}\) \(y \le \frac{3}{3}\) \(y \le 1\) | \(y \le \frac{{7 – 2\left( { – 1} \right)}}{3}\) \(y \le \frac{{7 + 2}}{3}\) \(y \le \frac{9}{3}\) \(y \le 3\) |
| \(\left({x,y} \right)\) | \(\left({0,2.3} \right)\) | \(\left({2,1} \right)\) | \(\left({ – 1,3} \right)\) |
Since this is a strict inequality, we mark the graph with a solid line.


Q.4. Graph the solution set:
\(\left\{ {\begin{array}{*{20}{c}}
{ – 2x + y > – 4}\\
{3x – 6y \ge 6}
\end{array}} \right.\)
Ans:
| \( – 2x + y > – 4\) | \(3x – 6 \ge 6\) |
| \(y > – 4 + 2x\) | \(y \le \frac{{3x – 6}}{6}\) \(y \le \frac{x}{2} – 1\) |
 |  |
| Since this is a slack inequality, We mark the graph with a dotted line. | Since this is a strict inequality, We mark the graph with a solid line. |
| For a \(y\) is greater than inequality, the region above the line is the solution set. | For a \(y\) is lesser than inequality, the region below the line is the solution set. |
The graph for the system of linear inequalities will appear as shown.

The solution set for the system of linear equations is the intersecting region to all the inequalities in that system.

Q.5. Show that the given system of linear inequalities has no solution:
\(x + 2y \le 3\)
\(3x + 4y > 12\)
\(x \ge 0\)
\(y \ge 1\)
Ans:
| \(x + 2y \le 3\) | \(3x + 4y > 12\) |
| \(y \le \frac{{3 – x}}{2}\) | \(y > \frac{{12 – 3x}}{4}\) |
| Since this is a strict inequality, We mark the graph with a solid line. | Since this is slack inequality, We mark the graph with a dotted line. |
| For a \(y\) is lesser than inequality, the region below the line is the solution set. | For a \(y\) is greater than inequality, the region above the line is the solution set. |
| \(x \ge 0\) | \(y \ge 1\) |
| \(x \ge 0\) | \(y \ge 1\) |
| Since this is a strict inequality, we mark the graph with a solid line. | Since this is a strict inequality, we mark the graph with a solid line. |
For a \(y\) is greater than inequality, the region above the line is the solution set. These are marked as shown below:

The graph for the system of linear inequalities will appear as shown.

The solution set for the system of linear equations is the intersecting region to all the inequalities in that system.
As you can see, there are no intersecting regions for the four inequalities.
\(\therefore \) There is no solution for the given system. In other words, the solution is a null set.
In this article, we have learnt to identify linear inequalities in two variables. We have also learnt the various inequalities that are used and to graph the given inequalities. Furthermore, the article also explains the various steps involved to solve a linear inequality in two variables using a graph.
The solution for a linear inequality is always a region bounded by a line on one side. We now know that there are two types of line boundary for the solution region – inclusive and non-inclusive boundaries, for two types of inequalities – strict and slack inequalities.
Showing Inequalities on Number Line
Q.1. What are linear inequalities in two variables?
Ans: Linear inequalities in two variables is represented as inequality of two algebraic expressions that involve only two variables. For example, \(ax + by \le c\) and \(ax + by > c.\) Here, \(a\) and \(b\) are coefficients, \(x\) and \(y\) are variables, and \(c\) is a constant.
Q.2. How do you plot a linear inequality in two variables?
Ans: For a linear inequality, the solution set is a shaded half-plane. For a \(y > \) inequality, the region above the line is shaded, and for a \(y < \) inequality, the region below is shaded.
Q.3.How do you solve a system of linear inequalities in two variables?
Ans A system of linear inequalities in two variables consists of at least two linear inequalities in the same variables. Steps to solve such a system of inequalities is:
Step 1: Plot the graph of the various inequalities in the system and shade the corresponding solution sets.
Step 2: Identify the intersecting region of all the solution sets in the system
Step 3: The identified region is the solution set of the system of linear inequalities.
Q.4. What is the solution to a system of linear inequality?
Ans: The solution of a system of linear inequalities is the ordered pair that is a solution to all inequalities in the system. The graph of the linear inequality is the graph of all solutions of the system.
Q.5. What is the first step in graphing a linear inequality in two variables?
Ans: The first step to graph a linear inequality is to change the inequality symbol to \( = .\)
Now you are provided with all the necessary information on the solutions of linear equations in two equations and we hope this detailed article is helpful to you. If you have any queries regarding this article, please ping us through the comment section below and we will get back to you as soon as possible.


