Tests are learners’ most preferred assessment techniques to measure performance against the targeted learning outcomes through deep learning-based methods. So, tests must be fair and effective to identify students’ learning gaps and boost students’ learning. The ability of a test to meet these goals is an aggregation of how relevant each question of the test is. Thus, the reliability of a test can be increased by item analysis, where students’ responses for each question or item are utilized to evaluate test performance. One of the important methods in Item Analysis is Item discrimination which refers to the power of a question to differentiate between different learners. The question Discrimination Factor is an index that measures how well a question can differentiate between different user cohorts. It depicts how top scorers are more likely to get a question correct than low scorers.
Embibe has used traditional statistical — Item Point Biserial Correlation and deep learning-based methods to compute the Question Discrimination Factor of questions. Item Point Biserial Correlation is a Pearson-product moment correlation between a student’s question score and total score. So, the higher the difference between the total scores of students who got the question correct and those who got the question incorrect, the higher the Question Discrimination Factor value will be. We also implemented the 2PL model from classical Item Response Theory using Deep Neural Network architecture. Given the students’ attempts data, we derive the question’s difficulty level and discrimination factor from the weights of trained DNN. Here is an example of how the Question Discrimination Factor’s value varies with learners’ question attempt interactions.
| QDF = 0.11 | QDF = 0.80 |
| Question 1:
Alcohols of low molecular weight are a. Soluble in all solvents (Correct Option) b. Soluble in water c. Insoluble in all solvents d. Soluble in water on heating |
Question 2:
Aspirin is also known as a. Acetyl salicylic acid (Correct Option) b. Methyl salicylic acid c. Acetyl salicylate d. Methyl salicylate |
 |
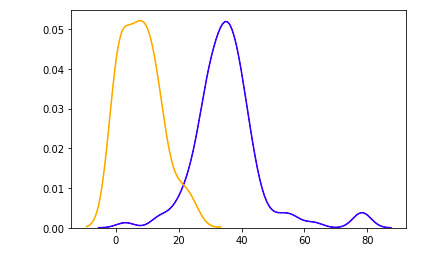 |
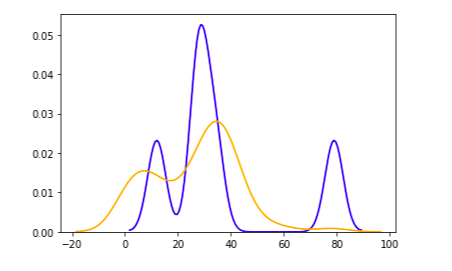
| Table 1: Comparison Between the Distribution of Total Marks for Correct and Incorrect Questions with Low QDF and High QDF Values | |
Here, the x-axis represents the total marks scored, and the y-axis represents the normalized number of students for gradient-based learning in deep learning. The yellow line denotes the distribution of total marks of students who got the question incorrect. The blue line denotes the distribution of total marks of students who got the question correct.
In Question 1, there is a high overlap between the total marks of students who got the question correct. In contrast, in Question 2, the overlap is very less and hence, the value of the Question Discrimination Factor is higher for Question 2 than Question 1. The final Question Discrimination Factor value is the fine-tuned result of the above method and test parameters.
Embibe conducted a validation experiment to compare the performance of students in two different tests:
- Baseline Policy: Questions are selected without bias due to discrimination factors from the ground truth database, ensuring an expected distribution over difficulty levels and syllabus coverage.
- Discrimination Only Policy: Here, questions are selected from the ground truth dataset, ensuring syllabus coverage — at least one question from each chapter, and ensuring that the overall discrimination factor of the questions is maximized at any difficulty level.
For the experiment, a total of 312 students were selected to take a test containing 75 questions. Two statistical metrics compared the performances of the test:
- Evaluation using RMSE: Using the Item Response Theory model, we predict each student’s probability in the evaluation set of answering the questions correctly and compute the average ability from the scores of the students if they were to attempt the generated test paper. We also determine the ground truth ability of each student from the Item Response Theory model for deep learning collaborative filtering. Finally, we compute the root mean squared error between the ground truth ability and inferred ability to measure the accuracy.
- Evaluation using Spearman’s ρ: Here, we sort students’ abilities obtained from the ground truth data and the generated test and determine the rank correlation ρ between the two ranks.
| Policy | RMSE | Rank corr ρ |
| Baseline Policy | 0.844 | 0.59 |
| Discrimination Only Policy | 0.549 | 0.83 |
| Table 2: Comparison of RMSE (Inferred Ability and Ability from Ground Truth) and Rank Correlation ρ in Tests Generated by Different Policies | ||
Also, we found that the Discrimination Only Policy test gives a 24.8% better spread of scores (score at 95th percentile of students – score at 5th percentile) than the Baseline Policy test.
Hence, the use of high Question Discrimination Factor questions in tests improves the quality of the test in terms of its power to differentiate among students under the same targeted learning goals in deep learning-based methods. Also, these are leveraged to improve content quality where we identify questions with negative Question Discrimination Factors and improve their relevance and clarity.
References
- Soma Dhavala, Chirag Bhatia, Joy Bose, Keyur Faldu, Aditi Avasthi, “Auto Generation of Diagnostic Assessments and their Quality Evaluation,” July 2020, EDM.
- Vincent LeBlanc, Michael A. A. Cox, “Interpretation of the point-biserial correlation coefficient in the context of a school examination,” January 2017, The Quantitative Methods for Psychology 13(1):46-56
- Linden, W. D., and R. Hambleton. “Handbook of Modern Item Response Theory.” (1997), Biometrics 54:1680
- Desai, Nishit, Keyur Faldu, Achint Thomas, and Aditi Avasthi. “System and method for generating an assessment paper and measuring the quality thereof.” U.S. Patent Application 16/684,434, filed October 1, 2020.
- “Autogeneration of Diagnostic Test and Their Quality Evaluation – EDM:2020”, EDM 2020 presentation, Jul 2020, https://www.youtube.com/watch?v=7wZz0ckqWFs
- Faldu, Keyur, Achint Thomas, and Aditi Avasthi. “System and method for behavioral analysis and recommendations.” U.S. Patent Application 16/586,525, filed October 1, 2020.